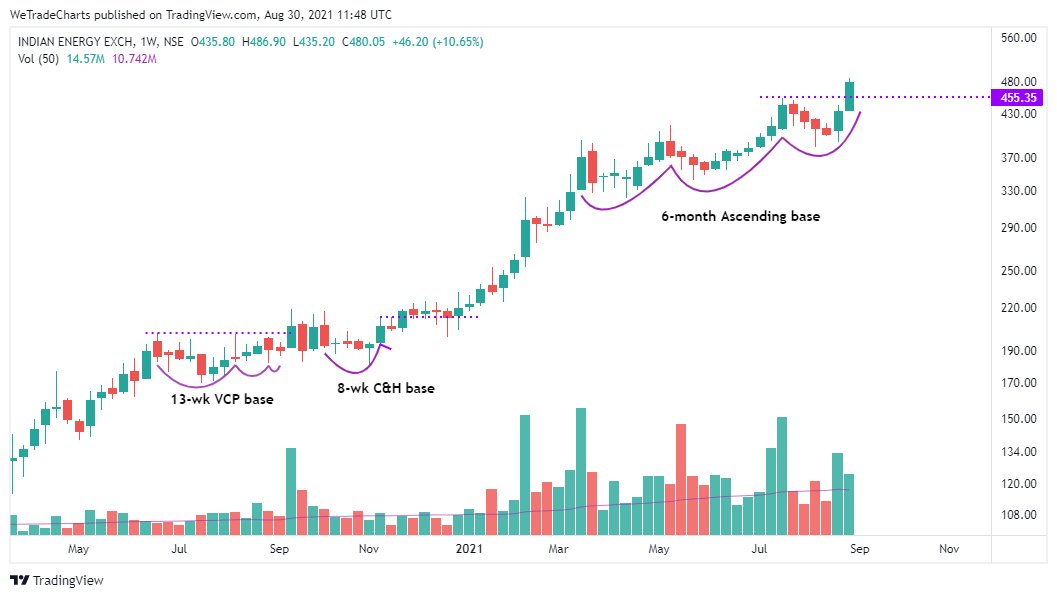
IEX Indian Energy Exchange - ⭕️⭕️
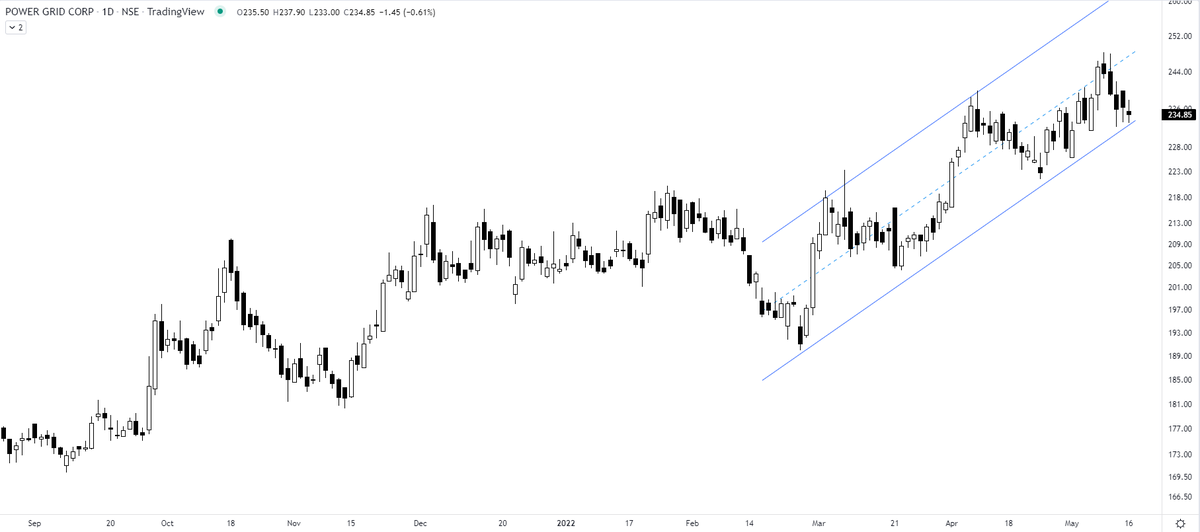
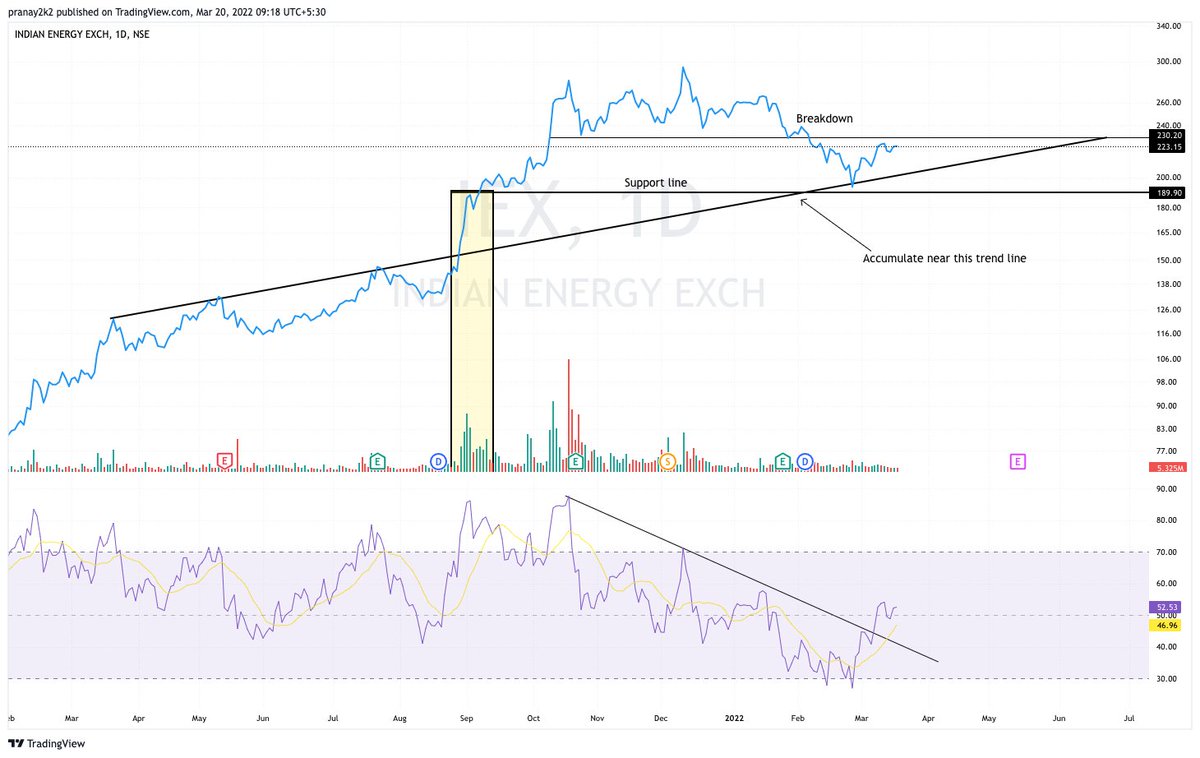
although a must-have portfolio stock. Faced resistance right at the upper channel boundary. Volumes high. Any retracement back to the lower boundary will be an opportunity to accumulate. https://t.co/5uDsUXsbPP
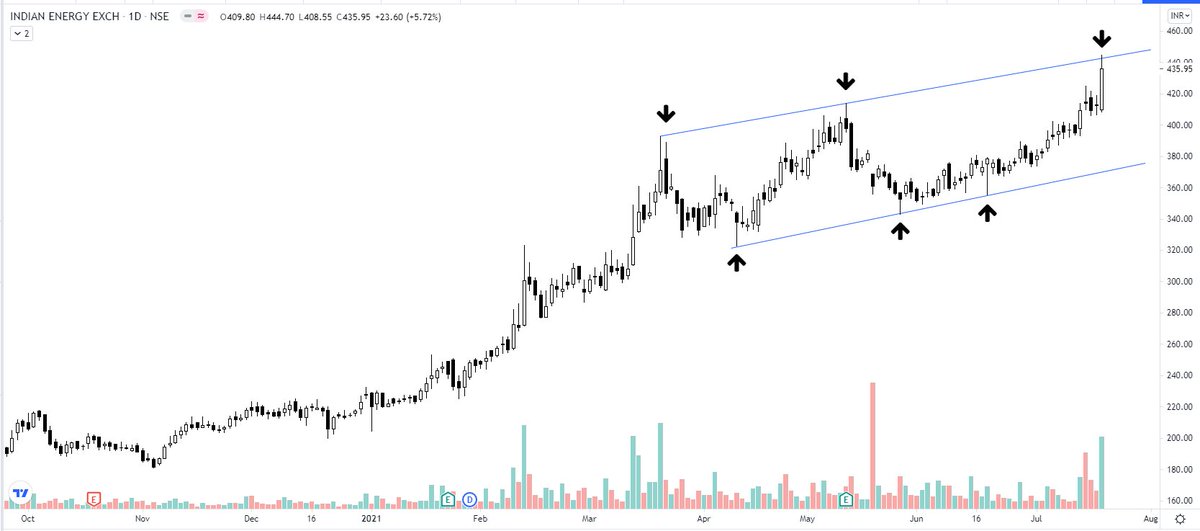
IEX - the resistance turning support. Kindly review, please. @nishkumar1977 @suru27 @rohanshah619 @indian_stockss @sanstocktrader @BissaGauravB @RajarshitaS @PAVLeader @Rishikesh_ADX @VijayThk @Investor_Mohit @TrendTrader85 pic.twitter.com/7CCzmee5If
— Steve Nison (@nison_steve) December 18, 2020
More from Steve Nison

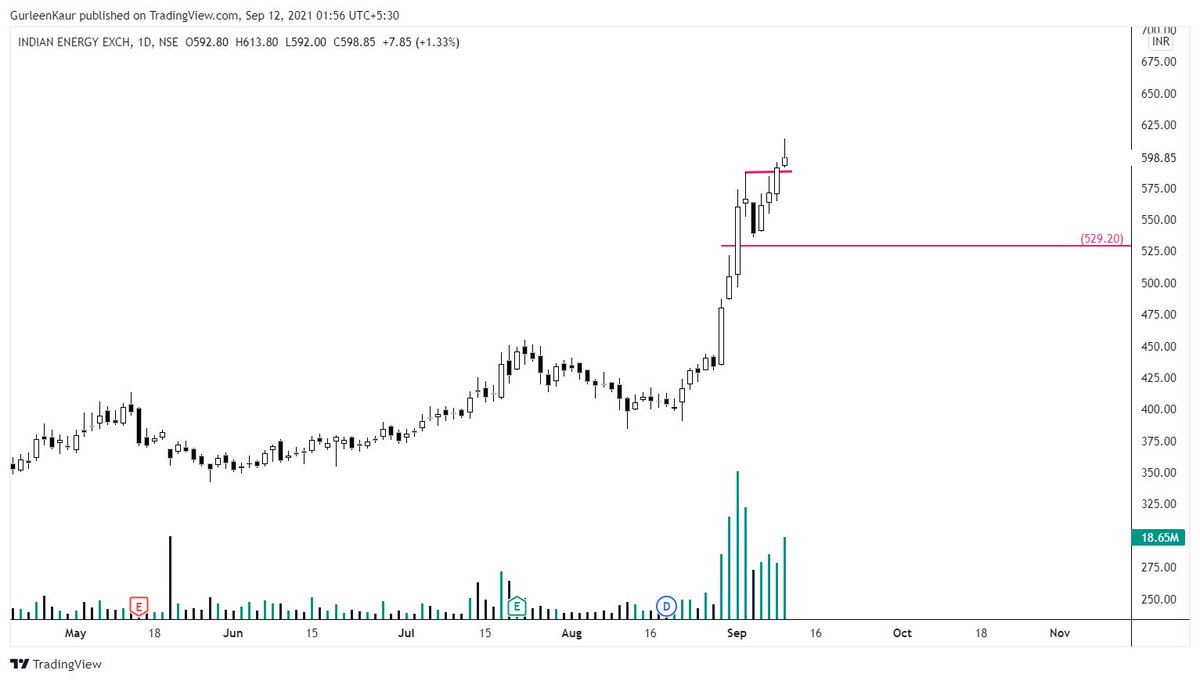
Explained you same concept with Elxsi. The real test of a strong Breakout is that the big hand will not give you another chance to buy the share at the breakout level. They will absorb all the selling of weak hands. I mean "STRONG breakout". https://t.co/7fxFqGQl3p
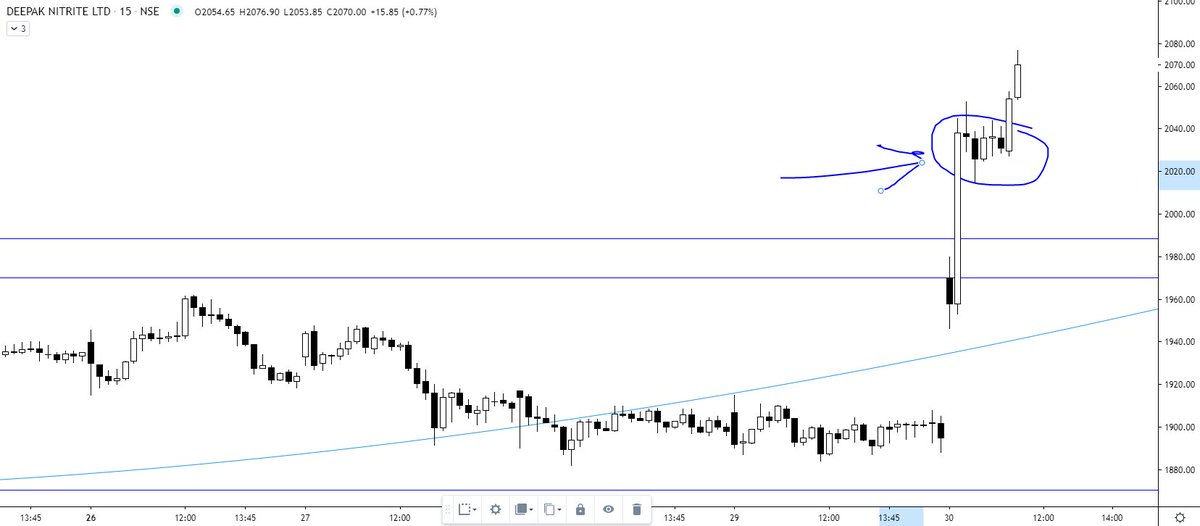
Tata Elxsi ---
— Steve Nison (@nison_steve) June 30, 2021
In the last 10 minutes, all the selling was absorbed despite intraday positions being squared off (if not converted). will wait for the EOD data. However, the chart structure is extremely strong. https://t.co/pci7GCDBEO pic.twitter.com/1NBD9V3mKc
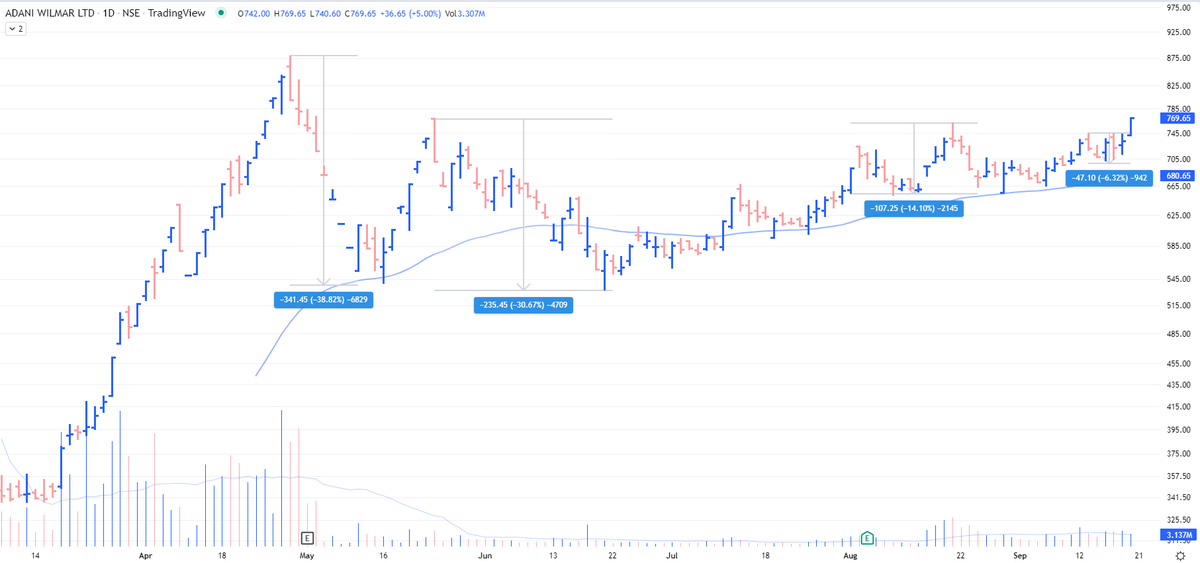
AWL - look at the ranges of contraction on the chart https://t.co/2XMhqZQu8X
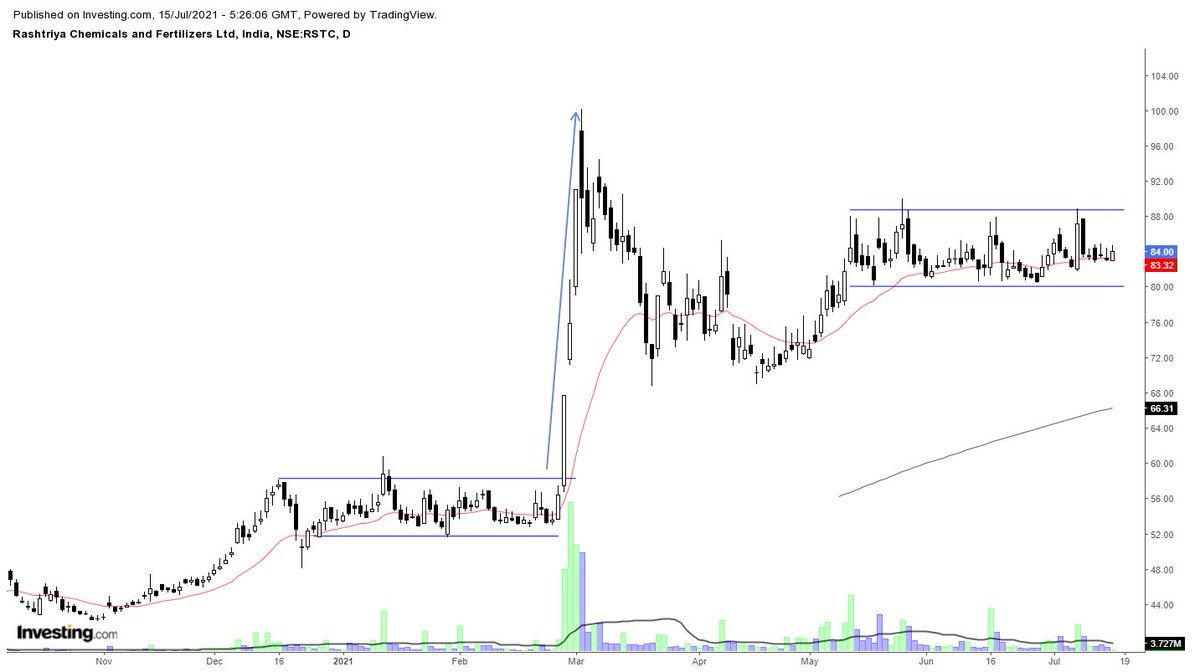
Borosil Renewables - Patterns like these must be looked at carefully and must be kept on the radar. Herein price is contracting which generally signifies shifting of hands (from weak to strong). If you go wrong, the risk is limited in these. pic.twitter.com/iqyoeslZjy
— The_Chartist \U0001f4c8 (@charts_zone) July 12, 2021