
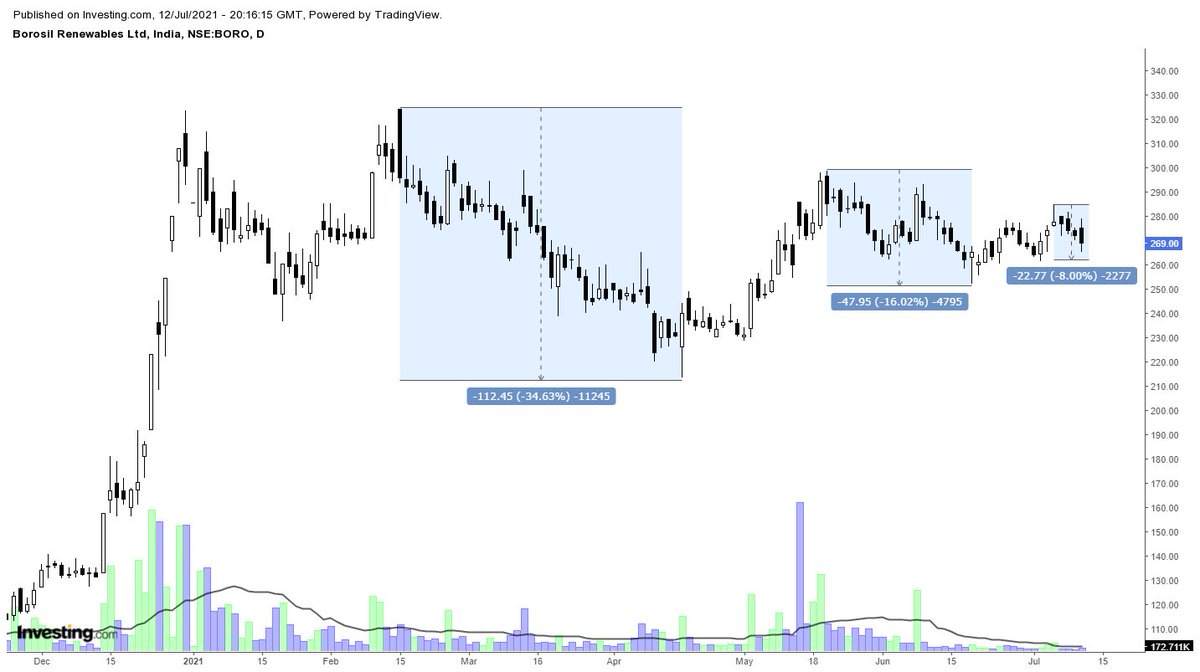
Reminded me of my Borosil renewables chart of last year in July.
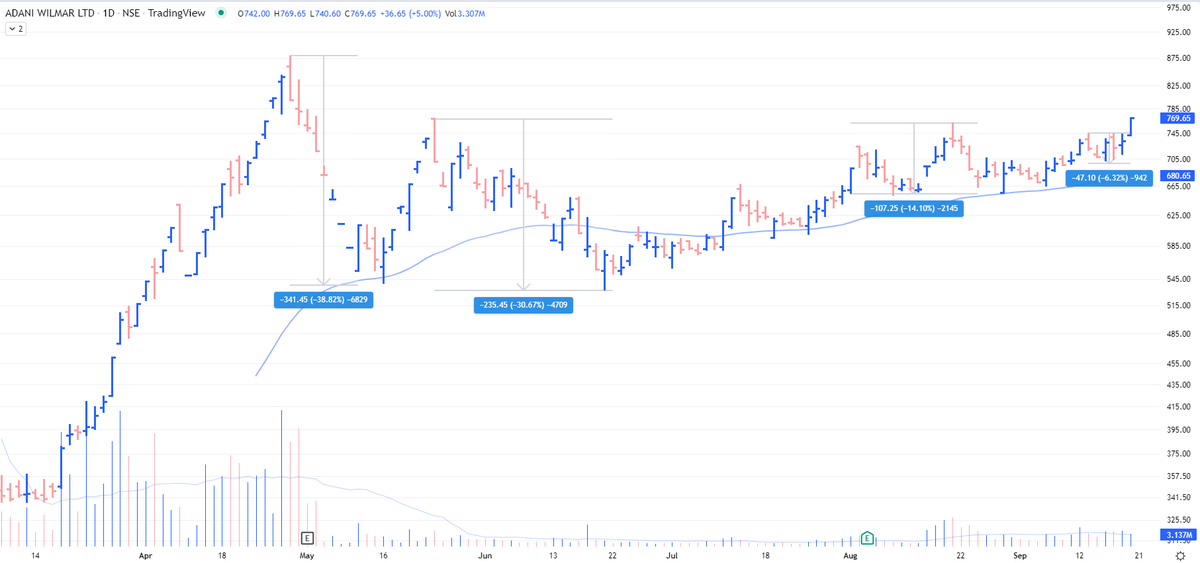
AWL - look at the ranges of contraction on the chart https://t.co/2XMhqZQu8X
Borosil Renewables - Patterns like these must be looked at carefully and must be kept on the radar. Herein price is contracting which generally signifies shifting of hands (from weak to strong). If you go wrong, the risk is limited in these. pic.twitter.com/iqyoeslZjy
— The_Chartist \U0001f4c8 (@charts_zone) July 12, 2021
More from The_Chartist 📈

You May Also Like


This is NONSENSE. The people who take photos with their books on instagram are known to be voracious readers who graciously take time to review books and recommend them to their followers. Part of their medium is to take elaborate, beautiful photos of books. Die mad, Guardian.
THEY DO READ THEM, YOU JUDGY, RACOON-PICKED TRASH BIN

If you come for Bookstagram, i will fight you.
In appreciation, here are some of my favourite bookstagrams of my books: (photos by lit_nerd37, mybookacademy, bookswrotemystory, and scorpio_books)

Beautifully read: why bookselfies are all over Instagram https://t.co/pBQA3JY0xm
— Guardian Books (@GuardianBooks) October 30, 2018
THEY DO READ THEM, YOU JUDGY, RACOON-PICKED TRASH BIN
If you come for Bookstagram, i will fight you.
In appreciation, here are some of my favourite bookstagrams of my books: (photos by lit_nerd37, mybookacademy, bookswrotemystory, and scorpio_books)
