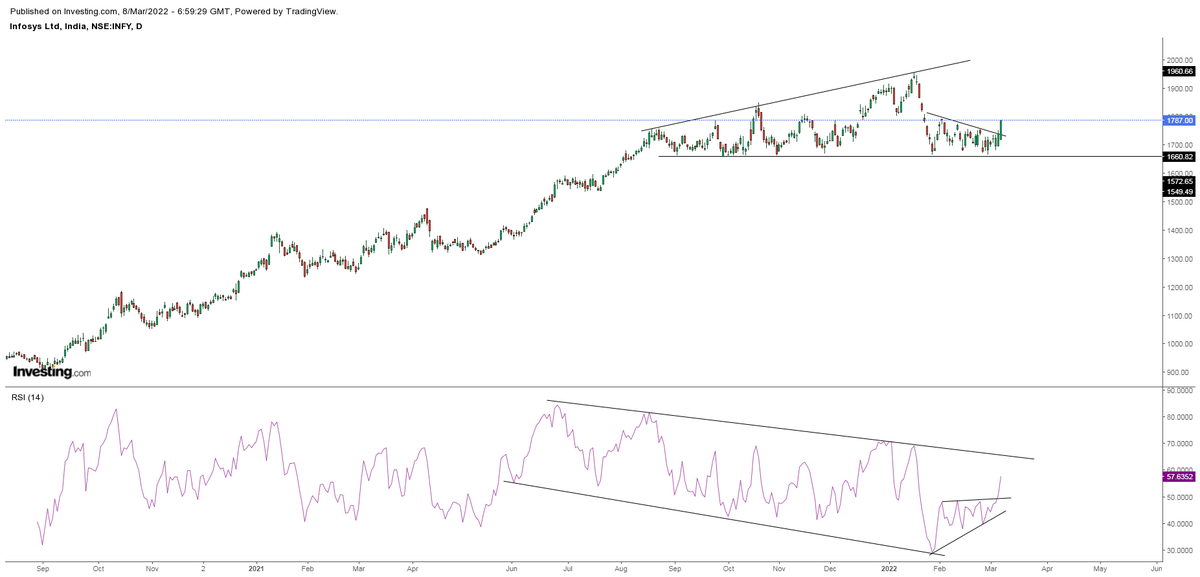
#Infy breaking above falling trendline, RSI in 125 min chart , moving 50+
Keep in watchlist
Not trading call, academic post
#stock #stocks #nifty

More from Techno Prince

Pls go to Nifty daily chart, convert candle stick chart to line chart
Make time period Weekly
Then click on the encircled + sign in top panel to add different index to compare, u can add any index
Will describe this in our Friday post market session, watch in SE YouTube channel
Make time period Weekly
Then click on the encircled + sign in top panel to add different index to compare, u can add any index
Will describe this in our Friday post market session, watch in SE YouTube channel
Sir can u please make a video on how to get this plotted in trading view .Please sir .a small guidance will be highly appreciated .I know there are many like me who don't know to plot it but are shy to admit .it would benefit them too .thank u sir
— rajesh shetty (@shettyrajeshs) May 4, 2021

#LTTS
#LLTS Weekly chart shows the stock is recovering from 61.8% fibonacci pullback of last major rise
— Techno Prince (@Trader_souradep) July 24, 2022
Daily chart shows a a rounding bottom , daily RSI bullish
If it sustains above 3500 it can move towards 3900+ levels and later towards 200 DMA 4480#Nifty pic.twitter.com/6ebtfLMJZd