
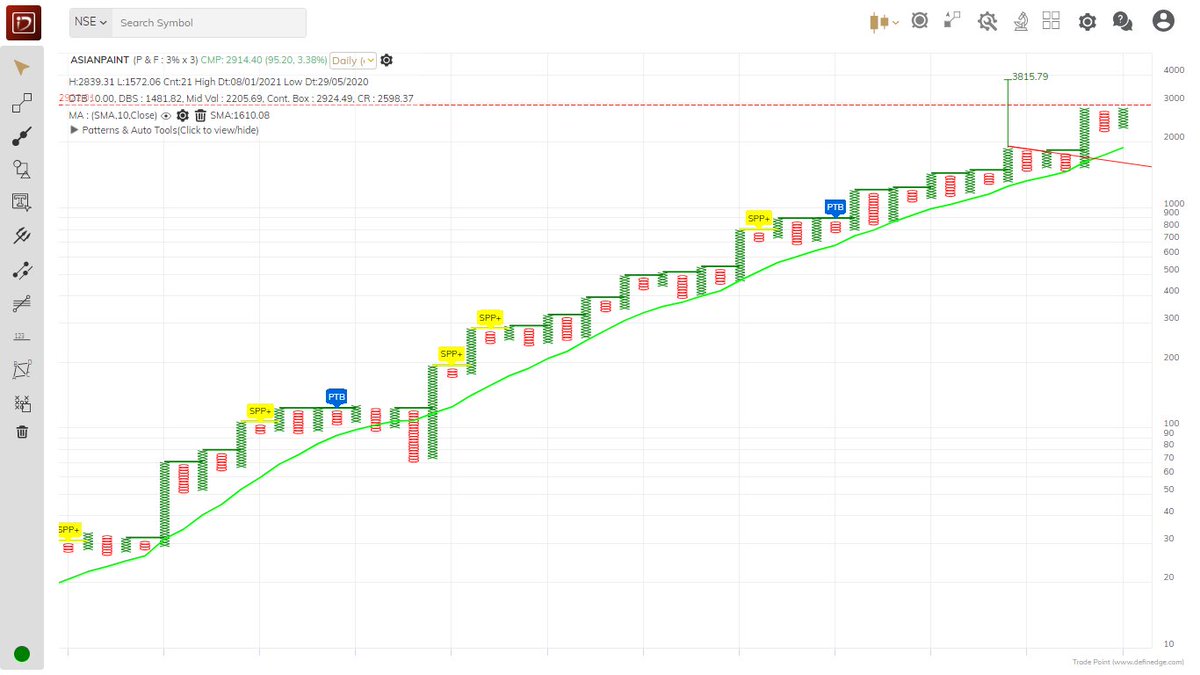
#ASIANPAINT weekly chart
RSI & MACD showing strength, price action is very bullish with a big marubozu candle
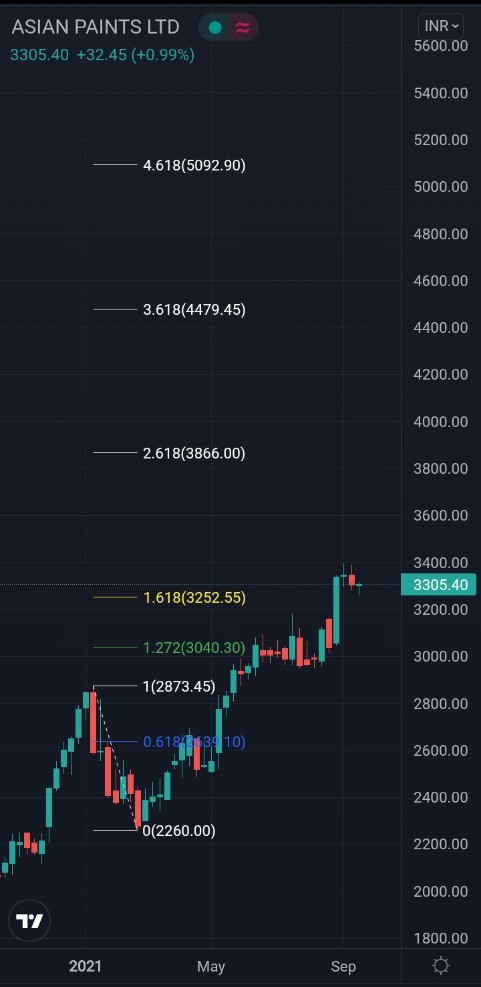
If momentum continues , the stock may head towards 3670-4550 region as shown by fibonacci extension in medium term if sustains above 3350
#Nifty

More from Techno Prince


Pls go to Nifty daily chart, convert candle stick chart to line chart
Make time period Weekly
Then click on the encircled + sign in top panel to add different index to compare, u can add any index
Will describe this in our Friday post market session, watch in SE YouTube channel
Make time period Weekly
Then click on the encircled + sign in top panel to add different index to compare, u can add any index
Will describe this in our Friday post market session, watch in SE YouTube channel
Sir can u please make a video on how to get this plotted in trading view .Please sir .a small guidance will be highly appreciated .I know there are many like me who don't know to plot it but are shy to admit .it would benefit them too .thank u sir
— rajesh shetty (@shettyrajeshs) May 4, 2021


More from Asianpaints


You May Also Like


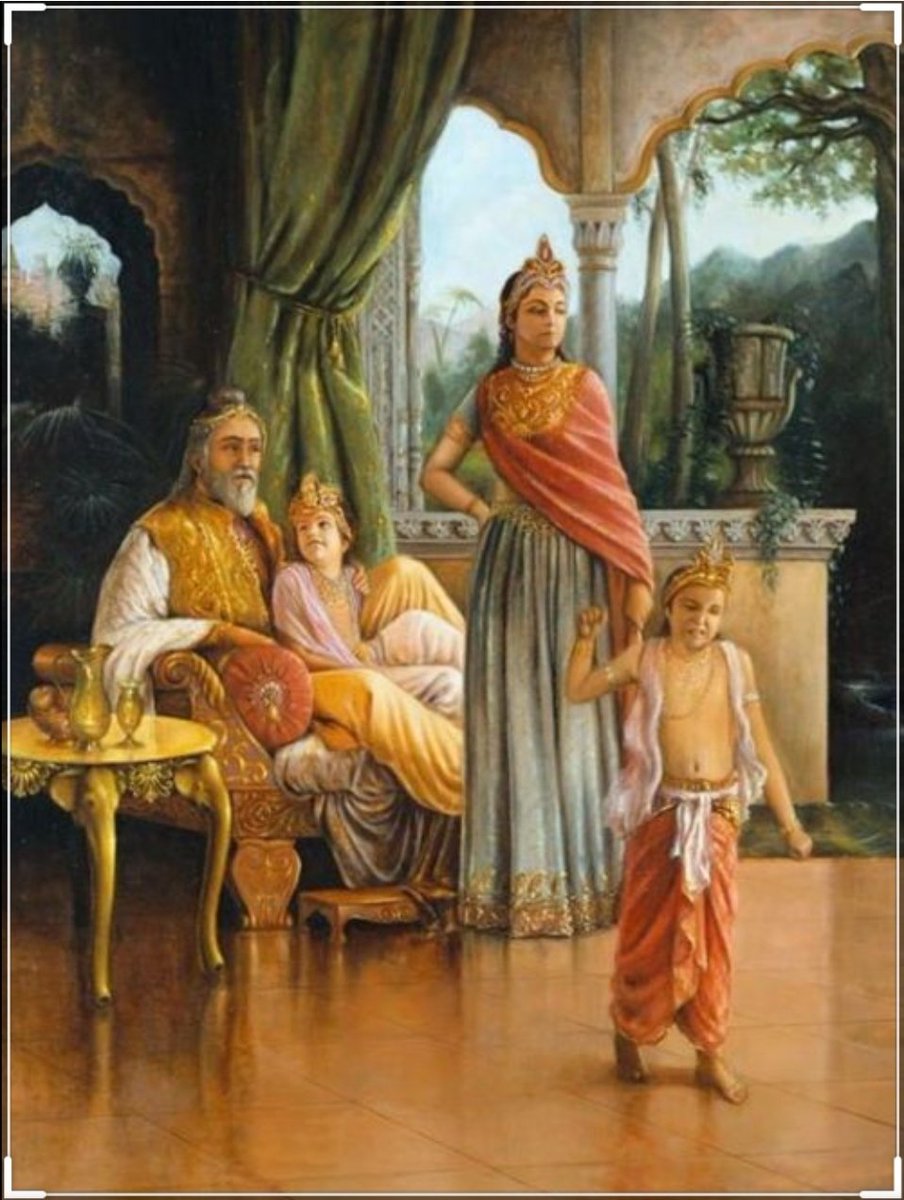
🌿𝑻𝒉𝒆 𝒔𝒕𝒐𝒓𝒚 𝒐𝒇 𝒂 𝑺𝒕𝒂𝒓 : 𝑫𝒉𝒓𝒖𝒗𝒂 & 𝑽𝒊𝒔𝒉𝒏𝒖
Once upon a time there was a Raja named Uttānapāda born of Svayambhuva Manu,1st man on earth.He had 2 beautiful wives - Suniti & Suruchi & two sons were born of them Dhruva & Uttama respectively.
#talesofkrishna https://t.co/E85MTPkF9W
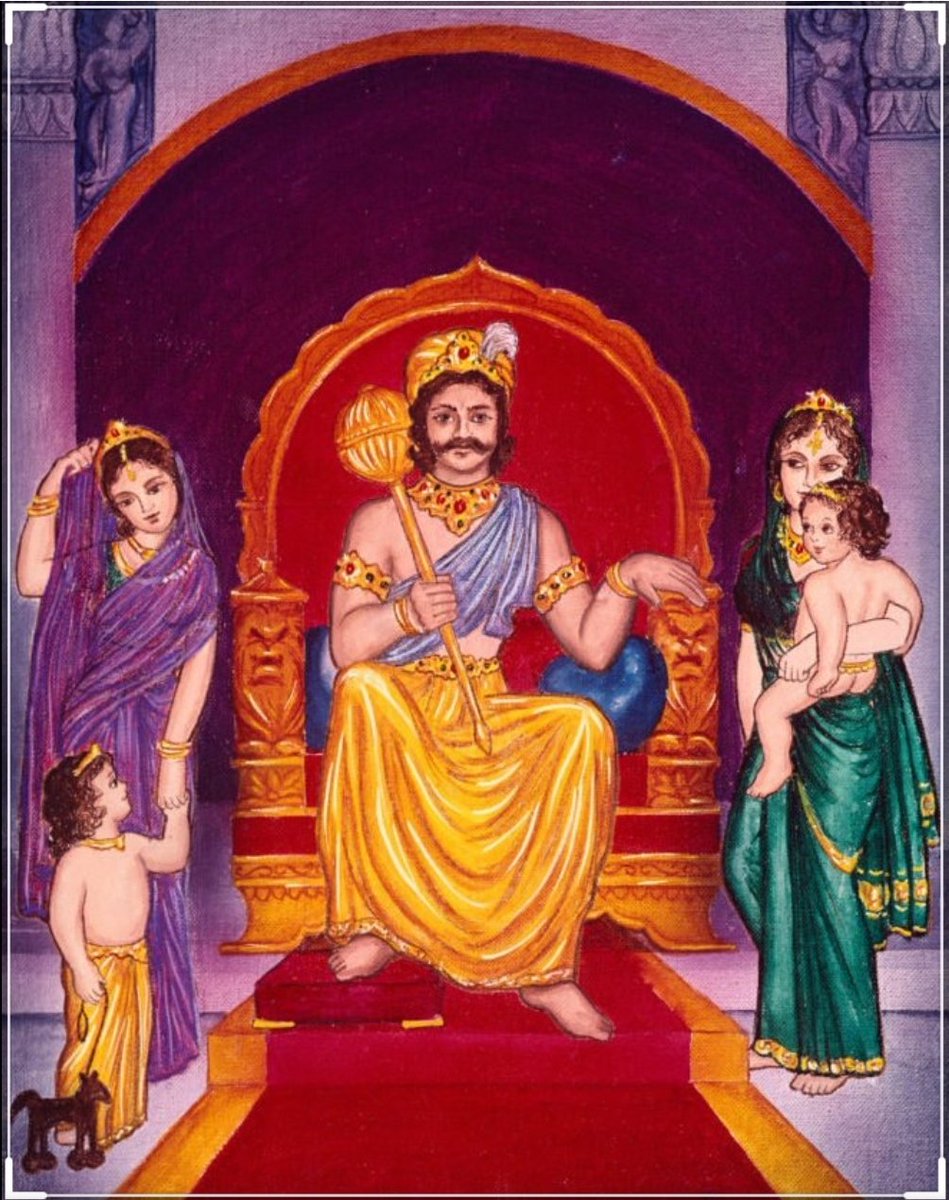
Now Suniti was the daughter of a tribal chief while Suruchi was the daughter of a rich king. Hence Suruchi was always favored the most by Raja while Suniti was ignored. But while Suniti was gentle & kind hearted by nature Suruchi was venomous inside.
#KrishnaLeela
The story is of a time when ideally the eldest son of the king becomes the heir to the throne. Hence the sinhasan of the Raja belonged to Dhruva.This is why Suruchi who was the 2nd wife nourished poison in her heart for Dhruva as she knew her son will never get the throne.
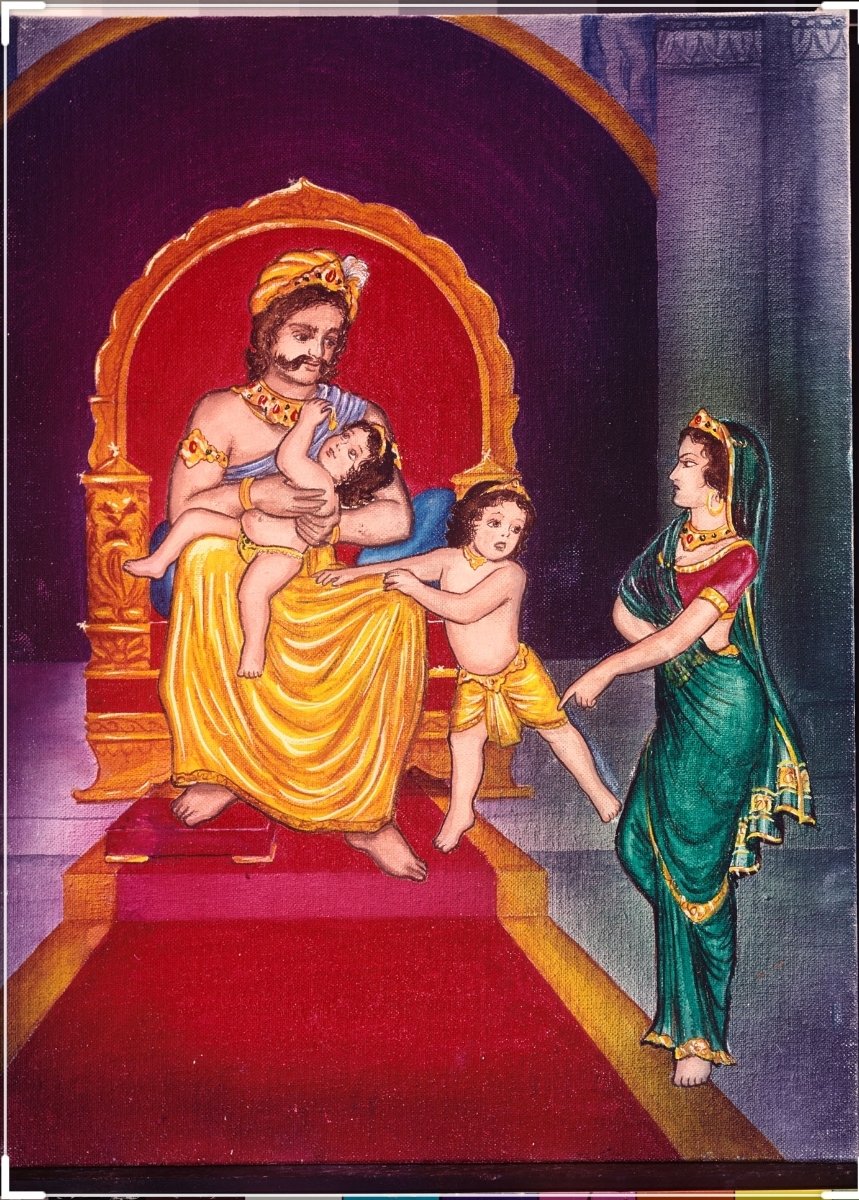
One day when Dhruva was just 5 years old he went on to sit on his father's lap. Suruchi, the jealous queen, got enraged and shoved him away from Raja as she never wanted Raja to shower Dhruva with his fatherly affection.
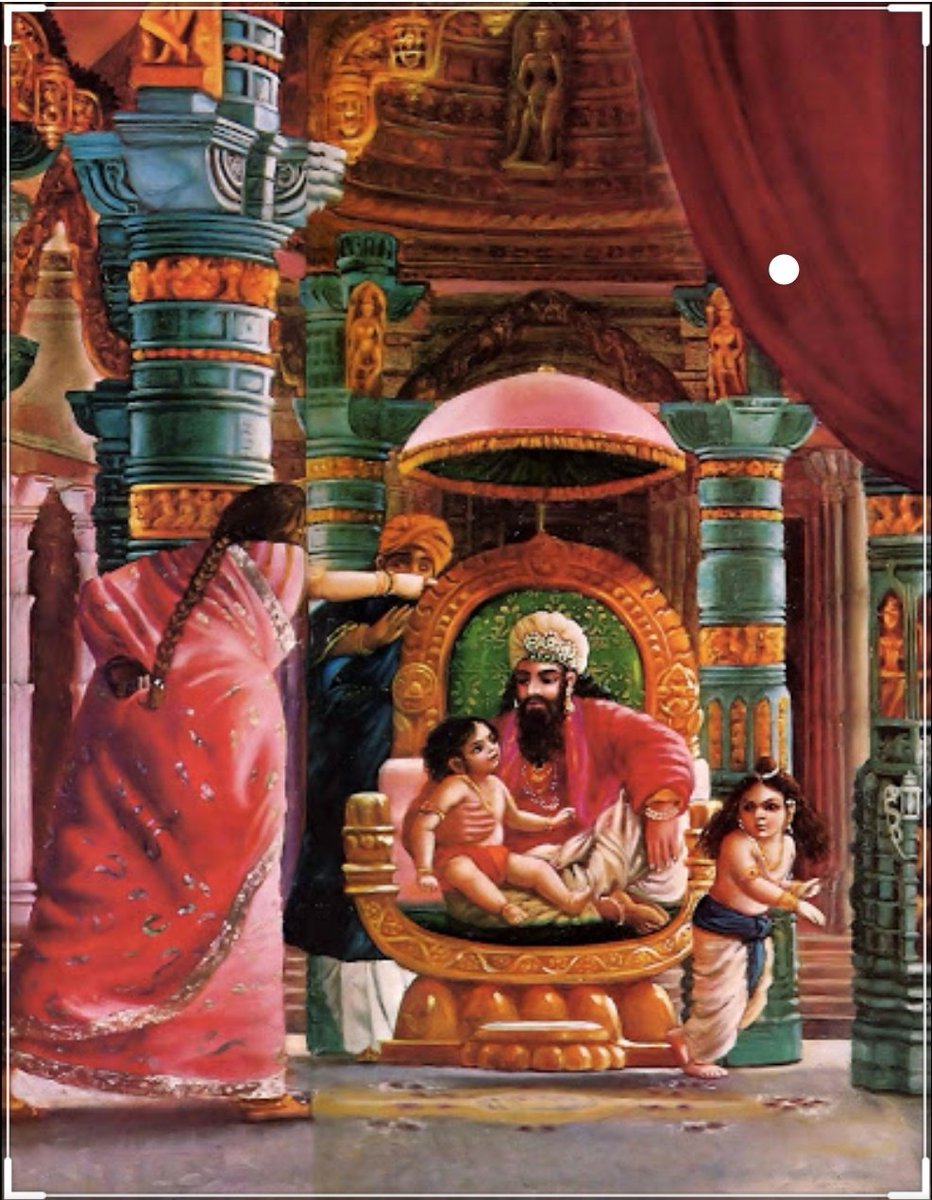
Dhruva protested questioning his step mother "why can't i sit on my own father's lap?" A furious Suruchi berated him saying "only God can allow him that privilege. Go ask him"
Once upon a time there was a Raja named Uttānapāda born of Svayambhuva Manu,1st man on earth.He had 2 beautiful wives - Suniti & Suruchi & two sons were born of them Dhruva & Uttama respectively.
#talesofkrishna https://t.co/E85MTPkF9W
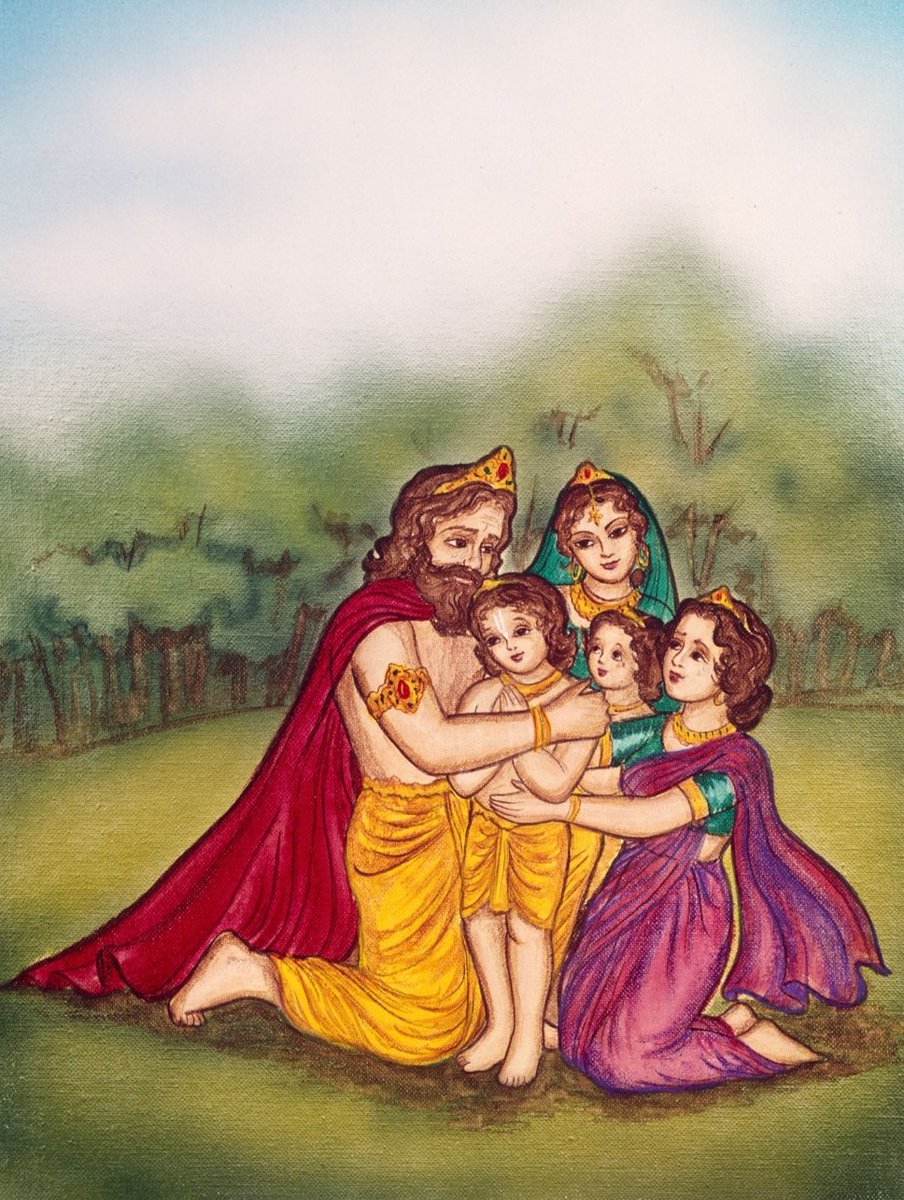
Prabhu says i reside in the heart of my bhakt.
— Right Singh (@rightwingchora) December 21, 2020
Guess the event. pic.twitter.com/yFUmbfe5KL
Now Suniti was the daughter of a tribal chief while Suruchi was the daughter of a rich king. Hence Suruchi was always favored the most by Raja while Suniti was ignored. But while Suniti was gentle & kind hearted by nature Suruchi was venomous inside.
#KrishnaLeela
The story is of a time when ideally the eldest son of the king becomes the heir to the throne. Hence the sinhasan of the Raja belonged to Dhruva.This is why Suruchi who was the 2nd wife nourished poison in her heart for Dhruva as she knew her son will never get the throne.
One day when Dhruva was just 5 years old he went on to sit on his father's lap. Suruchi, the jealous queen, got enraged and shoved him away from Raja as she never wanted Raja to shower Dhruva with his fatherly affection.
Dhruva protested questioning his step mother "why can't i sit on my own father's lap?" A furious Suruchi berated him saying "only God can allow him that privilege. Go ask him"


