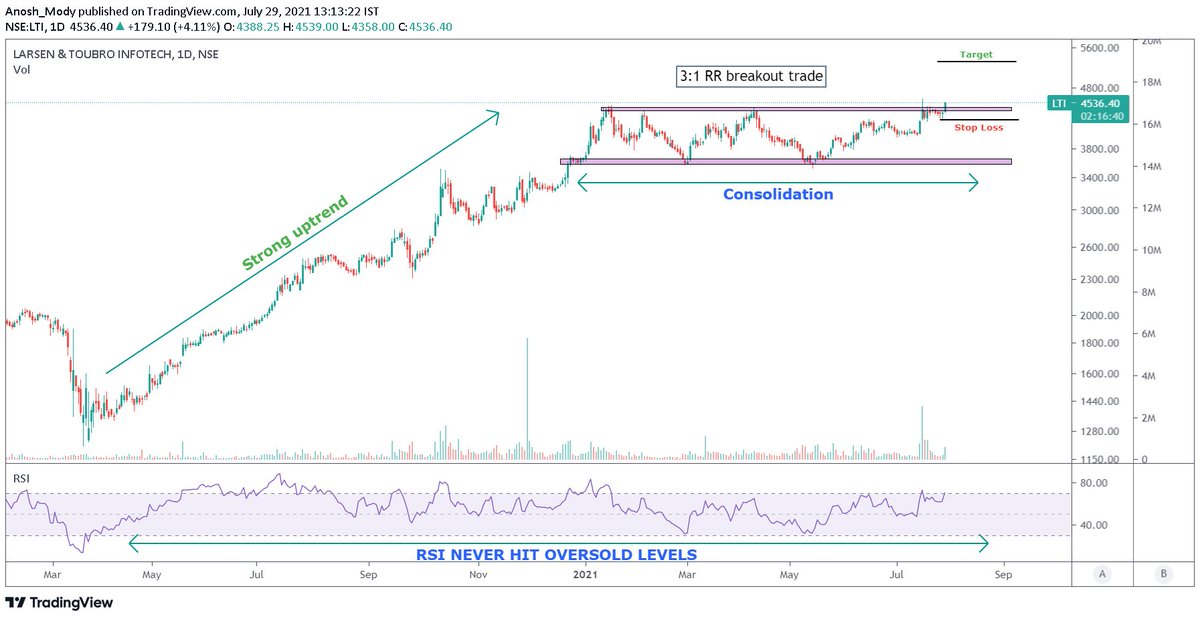
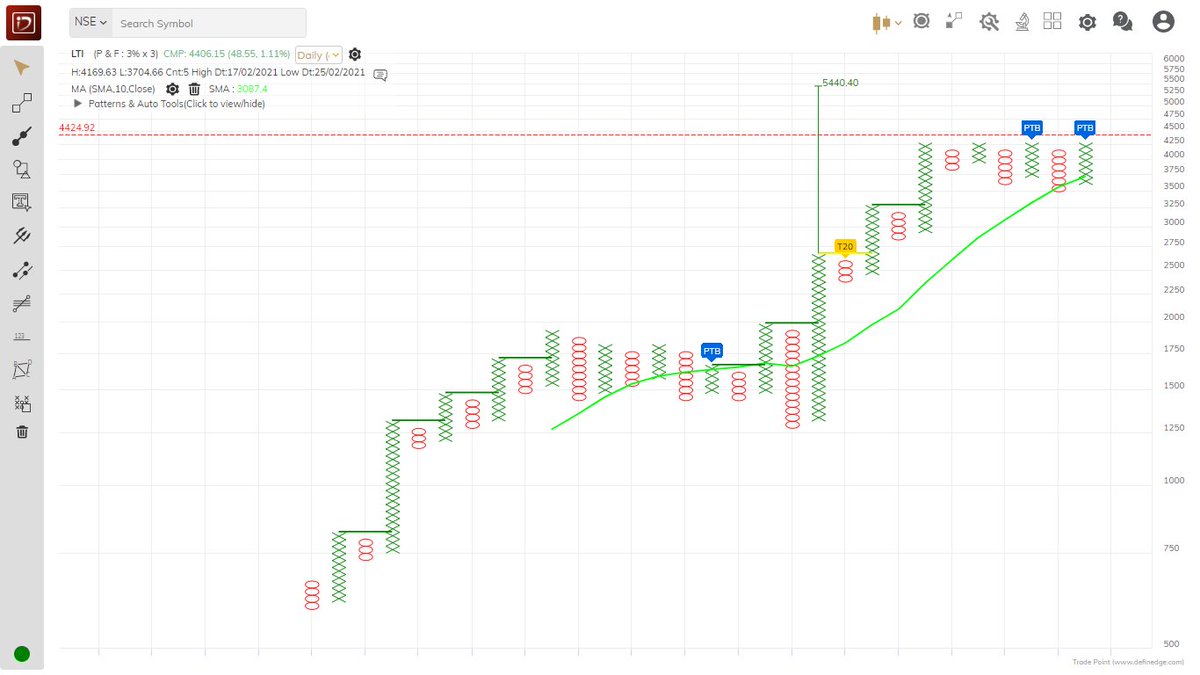
#LTI also rising from 61.8% pull back of last major rise
Volume was good last week
If stock sustains above 4500, it can rally towards 5200 in few weeks
#nifty #stocks
not trading call, academic post
More from Techno Prince
Pls go to Nifty daily chart, convert candle stick chart to line chart
Make time period Weekly
Then click on the encircled + sign in top panel to add different index to compare, u can add any index
Will describe this in our Friday post market session, watch in SE YouTube channel
Make time period Weekly
Then click on the encircled + sign in top panel to add different index to compare, u can add any index
Will describe this in our Friday post market session, watch in SE YouTube channel
Sir can u please make a video on how to get this plotted in trading view .Please sir .a small guidance will be highly appreciated .I know there are many like me who don't know to plot it but are shy to admit .it would benefit them too .thank u sir
— rajesh shetty (@shettyrajeshs) May 4, 2021
More from Lti
#LTI-6791
Done 6.857%(6537)
Here stock price may struggle for sometime due to Fibonacci series number (6765)
Now next objetive is to move higher
towards #Fibonacci extension
11.127%(9855)
#Probability
Done 6.857%(6537)
Here stock price may struggle for sometime due to Fibonacci series number (6765)
Now next objetive is to move higher
towards #Fibonacci extension
11.127%(9855)
#Probability
#LTI-6450
— Waves_Perception(Dinesh Patel) \u092e\u0948\u0902Schedule Tribes) (@idineshptl) September 24, 2021
Objective is 6.857%(6537) and than beyond it..#Probability https://t.co/WYAAgmV03y
#LTI -4614
Probability towards 4.618% and beyond..
#Possibility
Probability towards 4.618% and beyond..
#Possibility
#LTI -4145
— MaRkET WaVES (DINESH PATEL ) Stock Market FARMER (@idineshptl) July 14, 2021
Near term base Case (4024)
Look for 4.618% and 6.857%
Long term perspective Fibonacci extension shown in chart. #Perspective pic.twitter.com/Pyl0aGYIuS