
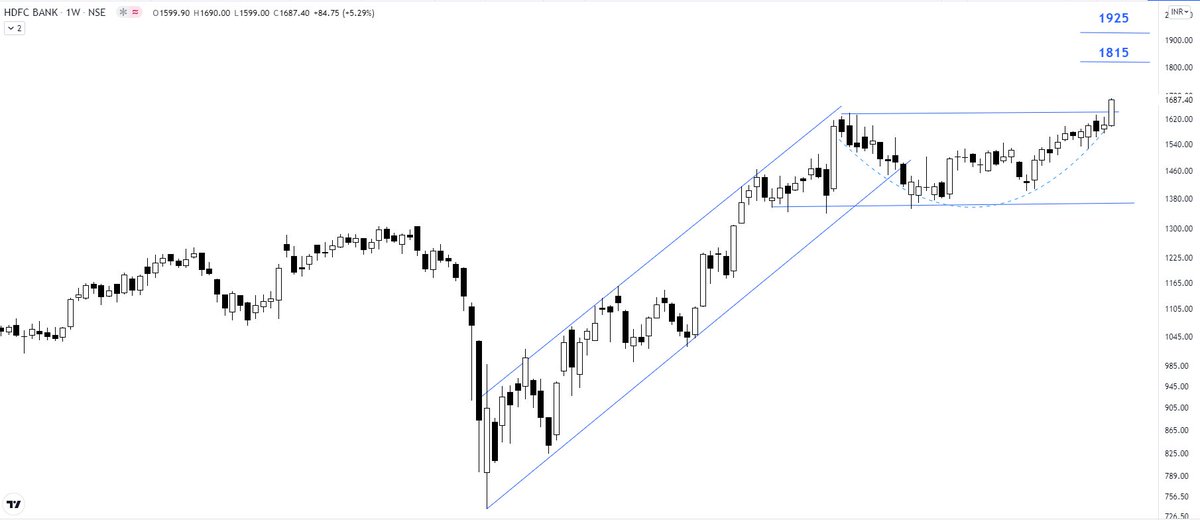
#HDFCBank daily chart broken above down trend line
RSI 50+ & sustaining above 50
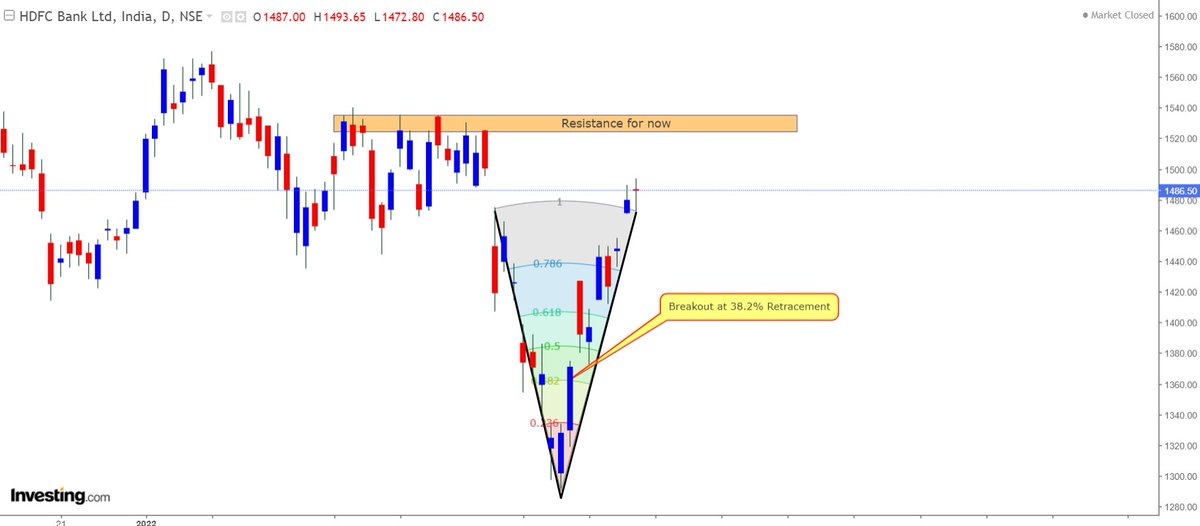
#Stock broke down trend line & consolidating in penant pattern
if it is able to break & sustain above 1920, it may move towards 2050-60 region
Not a trading call, academic post
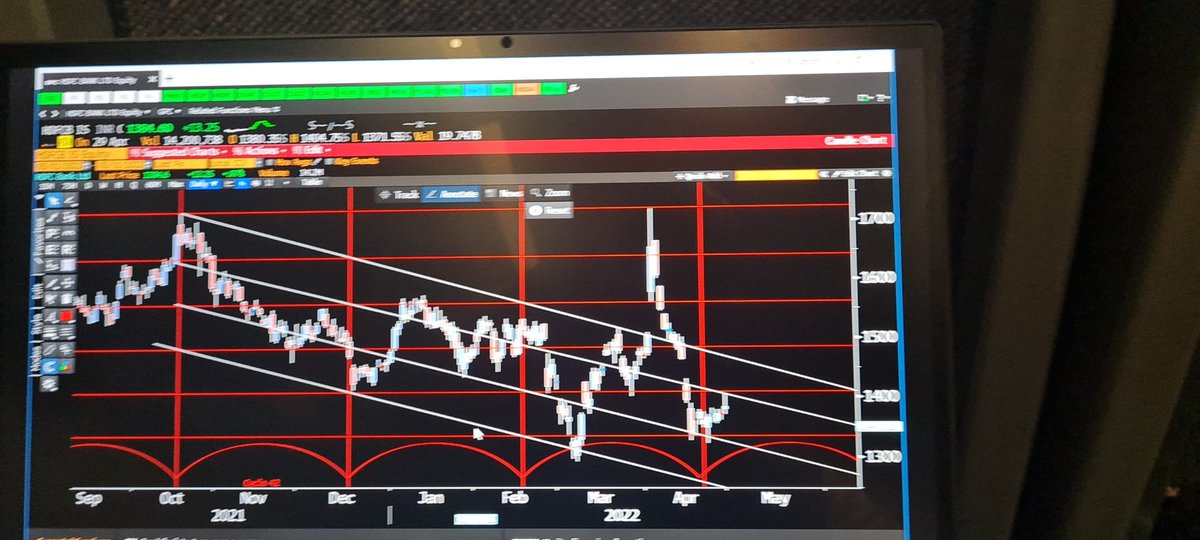
#Nifty #banknifty

More from Techno Prince


More from Hdfcbank


You May Also Like


A list of cool websites you might now know about
A thread 🧵
1) Learn Anything - Search tools for knowledge discovery that helps you understand any topic through the most efficient
2) Grad Speeches - Discover the best commencement speeches.
This website is made by me
3) What does the Internet Think - Find out what the internet thinks about anything
4) https://t.co/vuhT6jVItx - Send notes that will self-destruct after being read.


https://t.co/6cRR2B3jBE
Viruses and other pathogens are often studied as stand-alone entities, despite that, in nature, they mostly live in multispecies associations called biofilms—both externally and within the host.
https://t.co/FBfXhUrH5d

Microorganisms in biofilms are enclosed by an extracellular matrix that confers protection and improves survival. Previous studies have shown that viruses can secondarily colonize preexisting biofilms, and viral biofilms have also been described.

...we raise the perspective that CoVs can persistently infect bats due to their association with biofilm structures. This phenomenon potentially provides an optimal environment for nonpathogenic & well-adapted viruses to interact with the host, as well as for viral recombination.

Biofilms can also enhance virion viability in extracellular environments, such as on fomites and in aquatic sediments, allowing viral persistence and dissemination.

Viruses and other pathogens are often studied as stand-alone entities, despite that, in nature, they mostly live in multispecies associations called biofilms—both externally and within the host.
https://t.co/FBfXhUrH5d
Microorganisms in biofilms are enclosed by an extracellular matrix that confers protection and improves survival. Previous studies have shown that viruses can secondarily colonize preexisting biofilms, and viral biofilms have also been described.
...we raise the perspective that CoVs can persistently infect bats due to their association with biofilm structures. This phenomenon potentially provides an optimal environment for nonpathogenic & well-adapted viruses to interact with the host, as well as for viral recombination.
Biofilms can also enhance virion viability in extracellular environments, such as on fomites and in aquatic sediments, allowing viral persistence and dissemination.