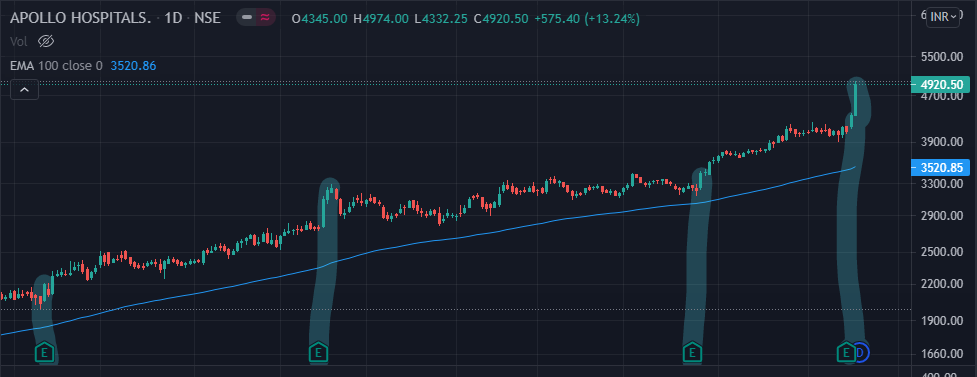
#APOLLOHOSP broke out of a huge falling wedge, immediate resistance 200 Day SMA 4462, RSI & MACD are beautifully poised for an up-move
Sustaining above 4500, it can rally towards 4900
#stocks
Not trading call , academic post

More from Techno Prince


More from Apollohospitals



On track to 5850...
As per traditional chart analysis, the breakout from the flag can extend by a distance of the flagpole which gives us the price objective of 5850 or thereabouts.
Let's see what happens!
#ApolloHospital https://t.co/jHgjR2WThe
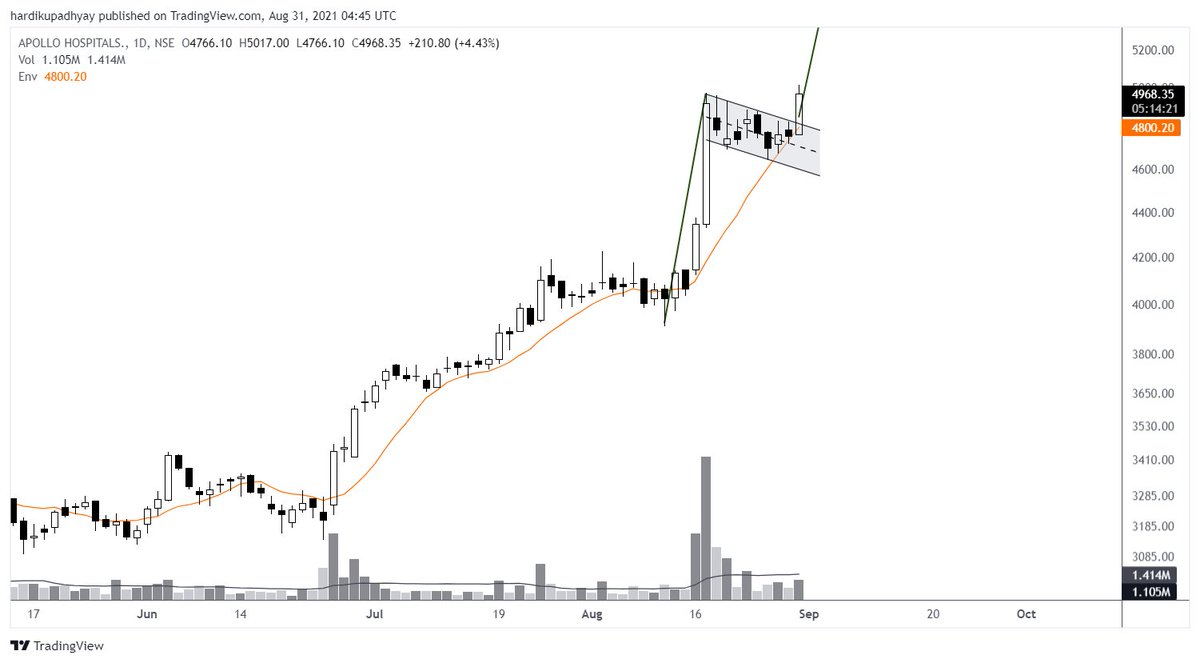
As per traditional chart analysis, the breakout from the flag can extend by a distance of the flagpole which gives us the price objective of 5850 or thereabouts.
Let's see what happens!
#ApolloHospital https://t.co/jHgjR2WThe
Looks like a Flag to me...
— Hardik Upadhyay, CMT. (@tradingwithdyr) August 30, 2021
A flag pattern is a continuation pattern that suggests a short-term consolidation in opposite direction preceding a strong move.
A breakout above 4850 could have a rapid movement!#ApolloHospitals pic.twitter.com/q7g4enQjRY