
A story ...
In 1994, I was teaching U.S. history and American government at Oak Ridge HS in El Dorado Hills, California.
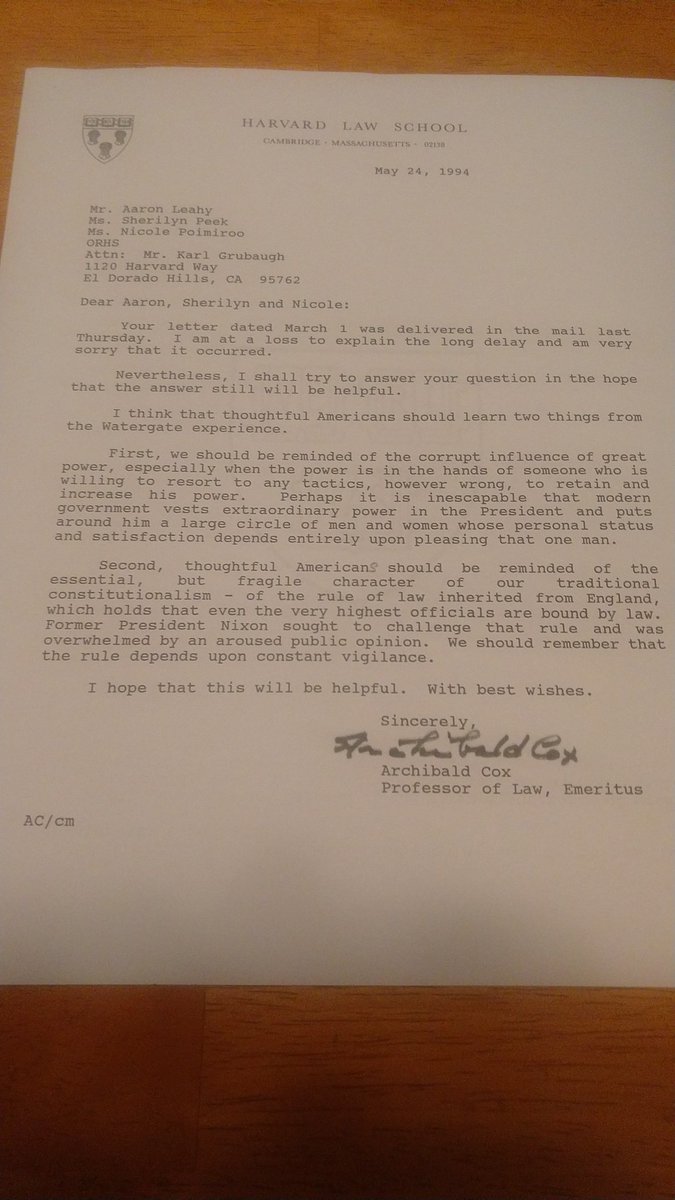
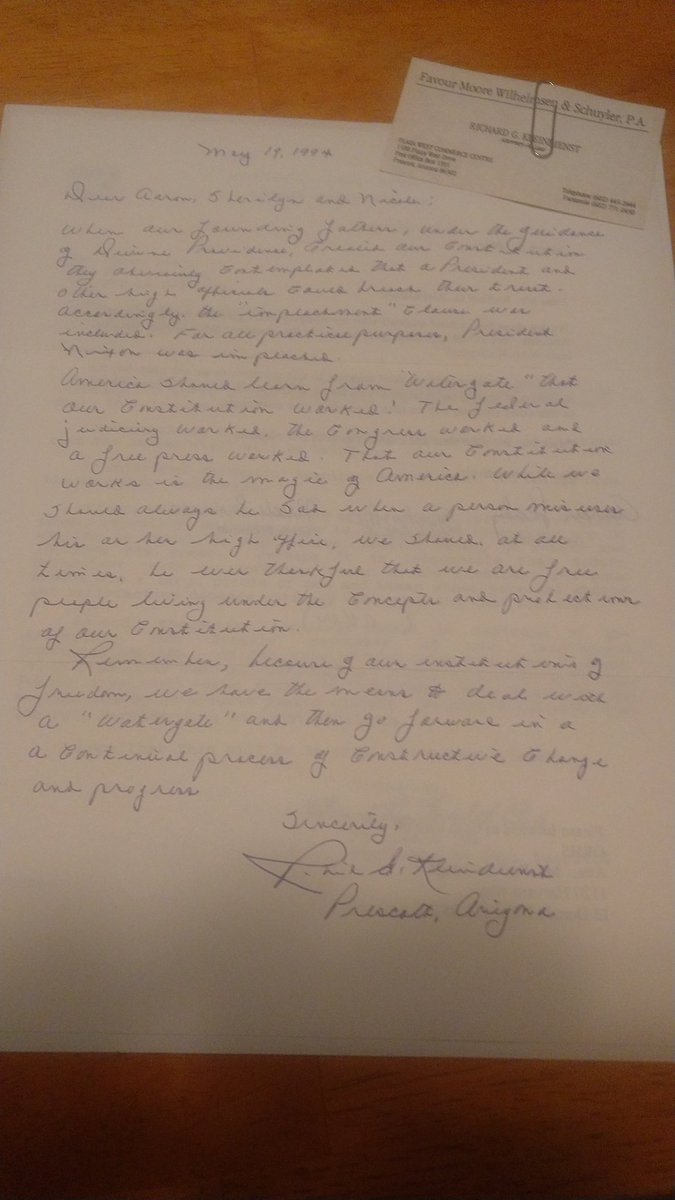
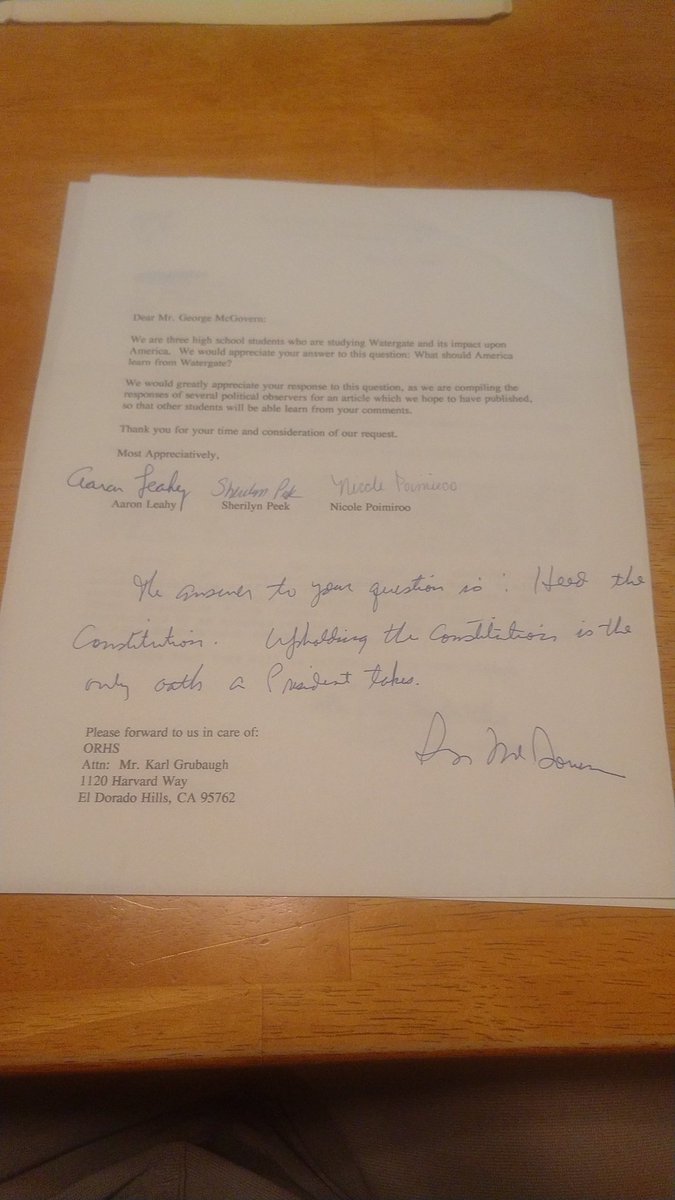
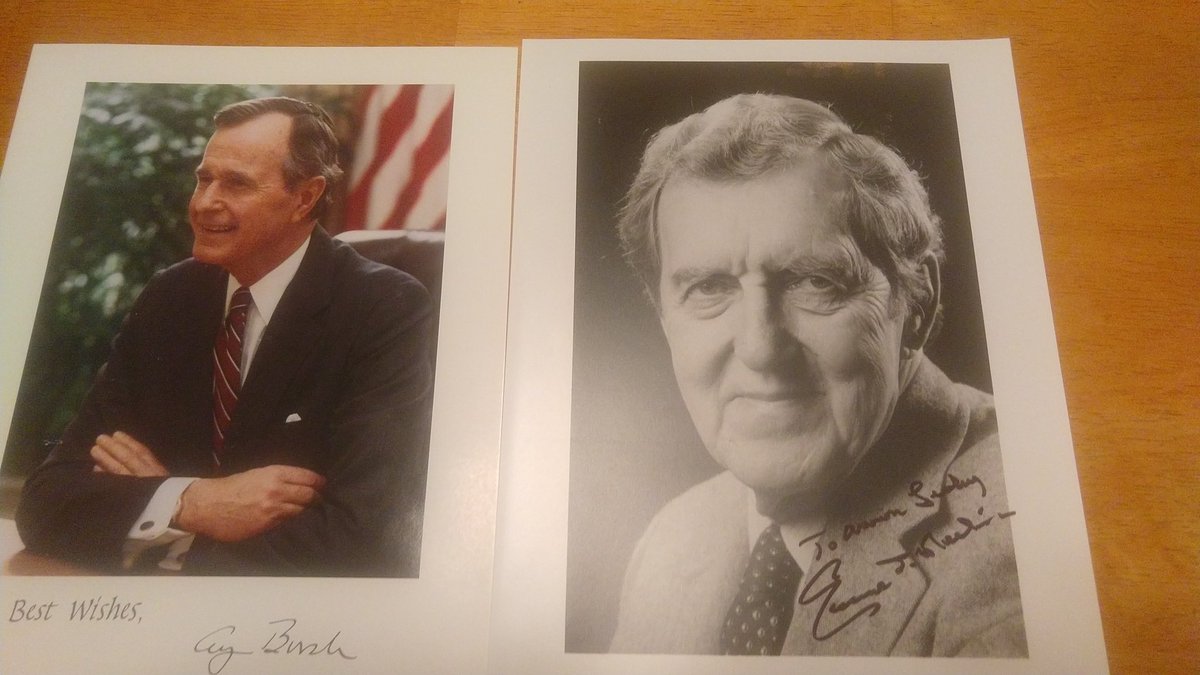
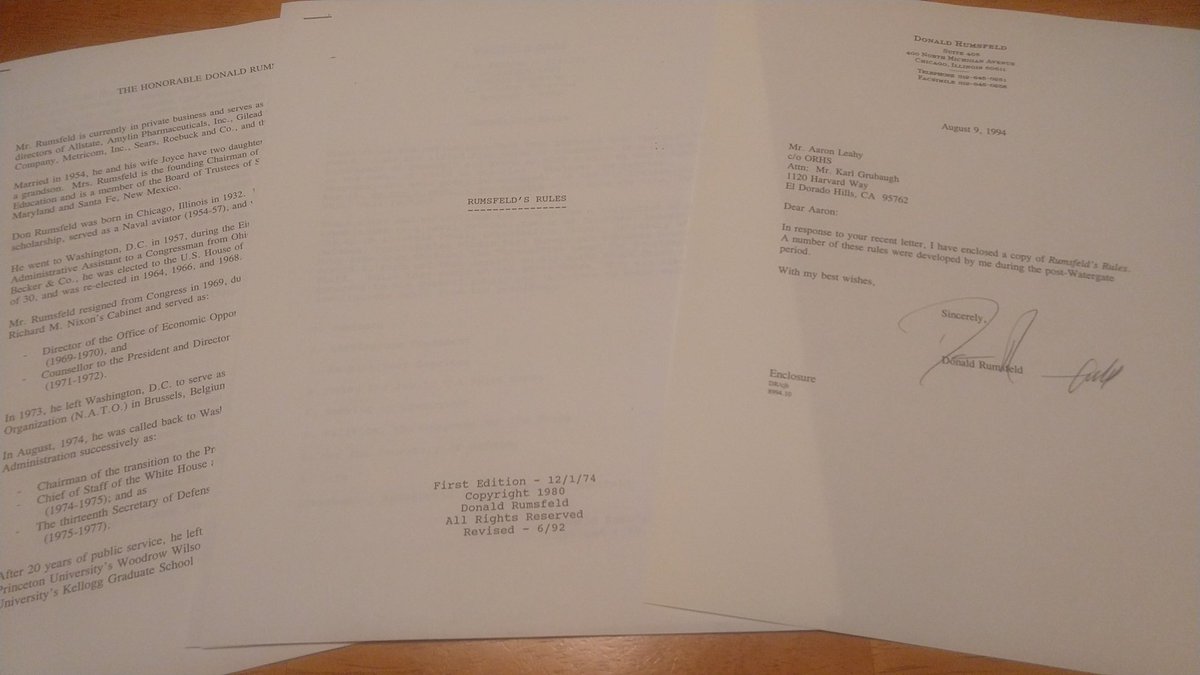
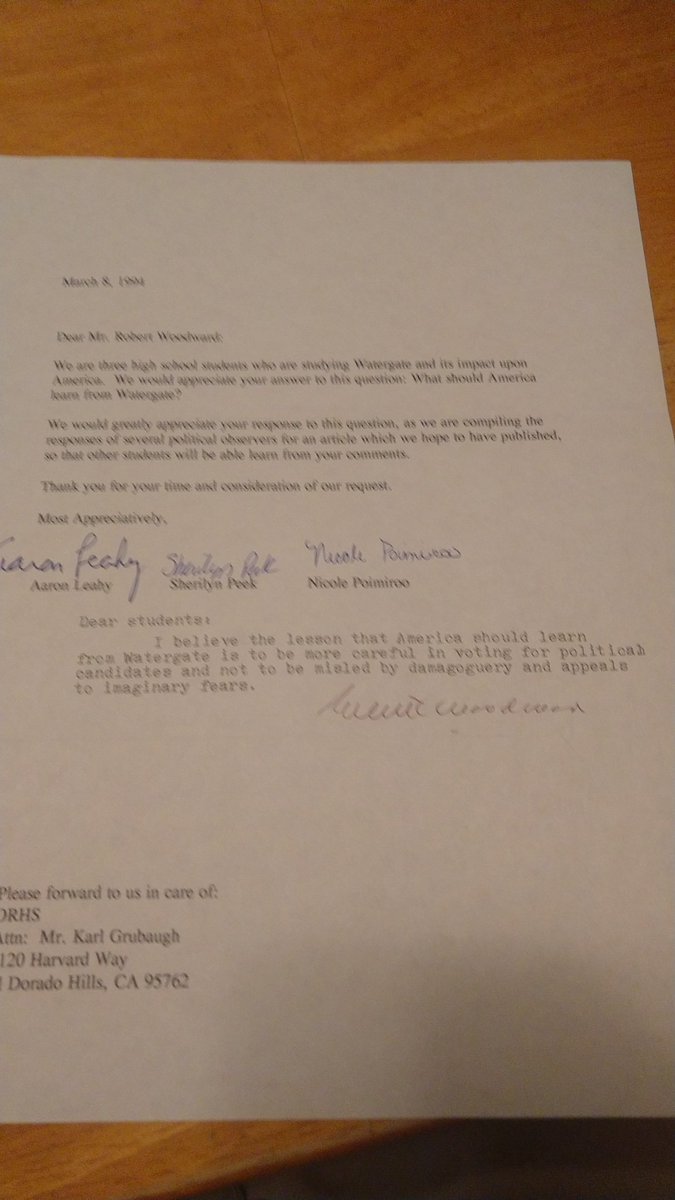
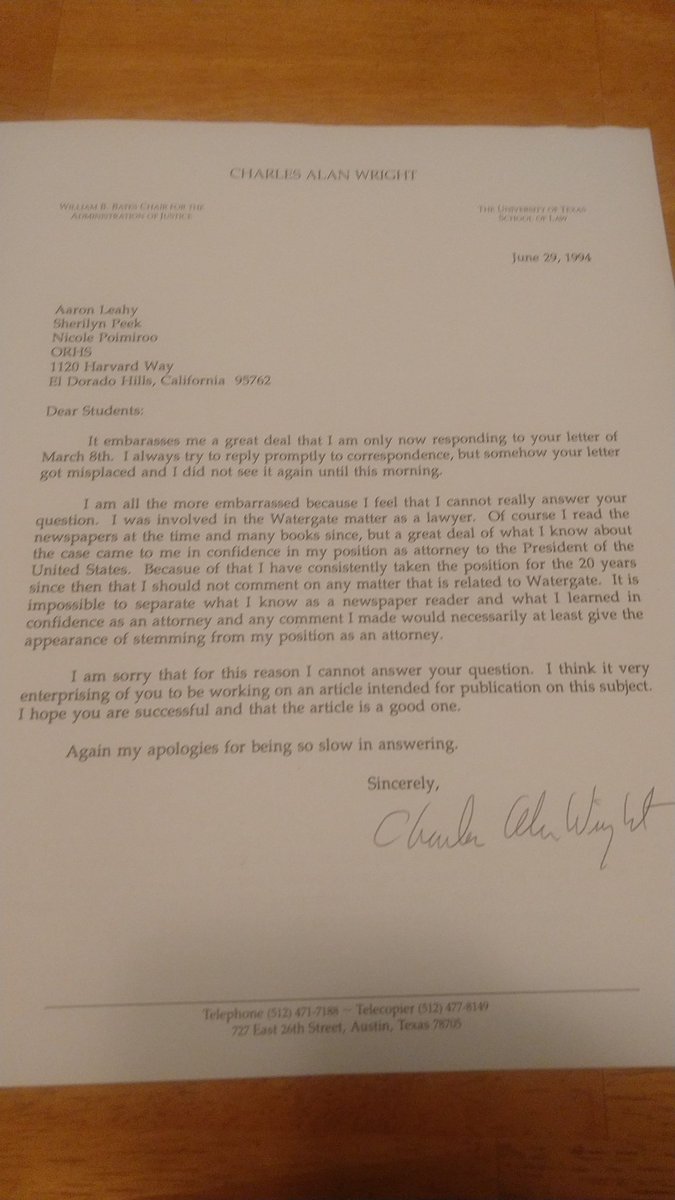
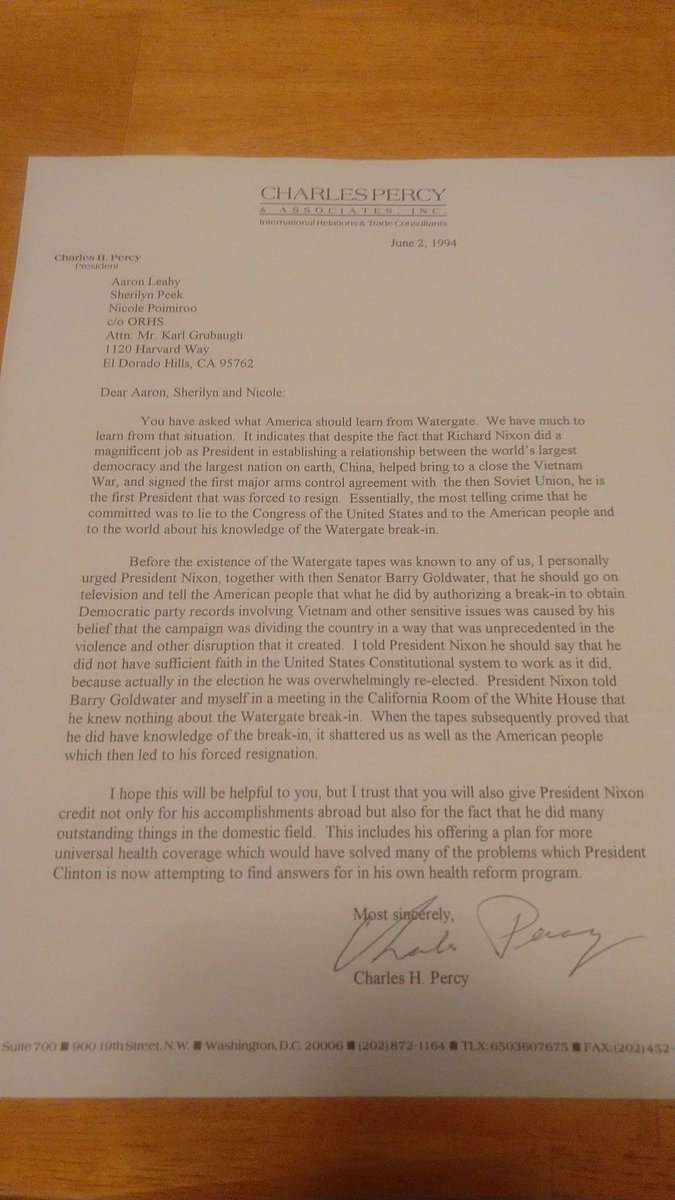
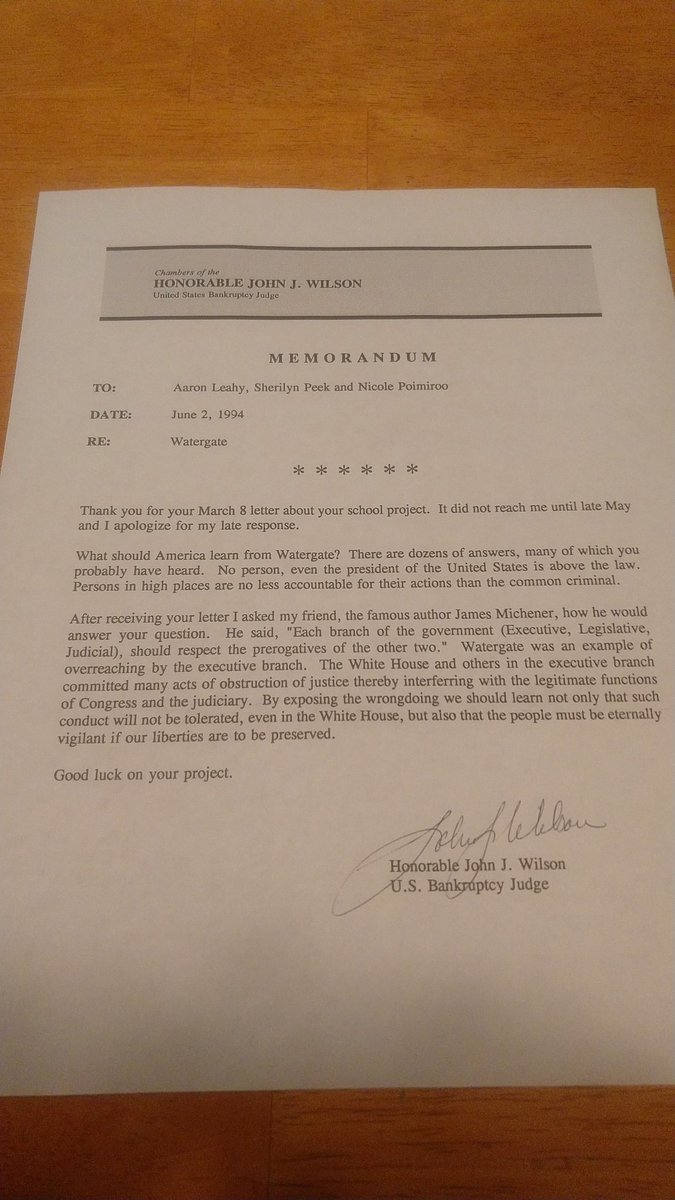
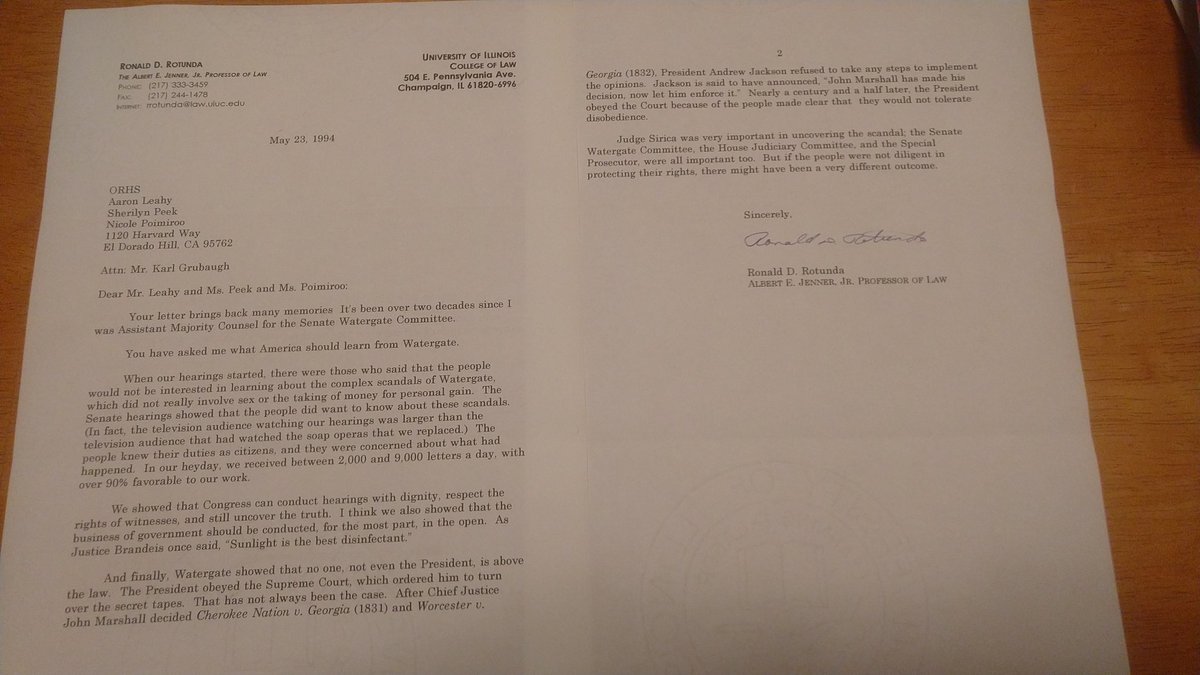
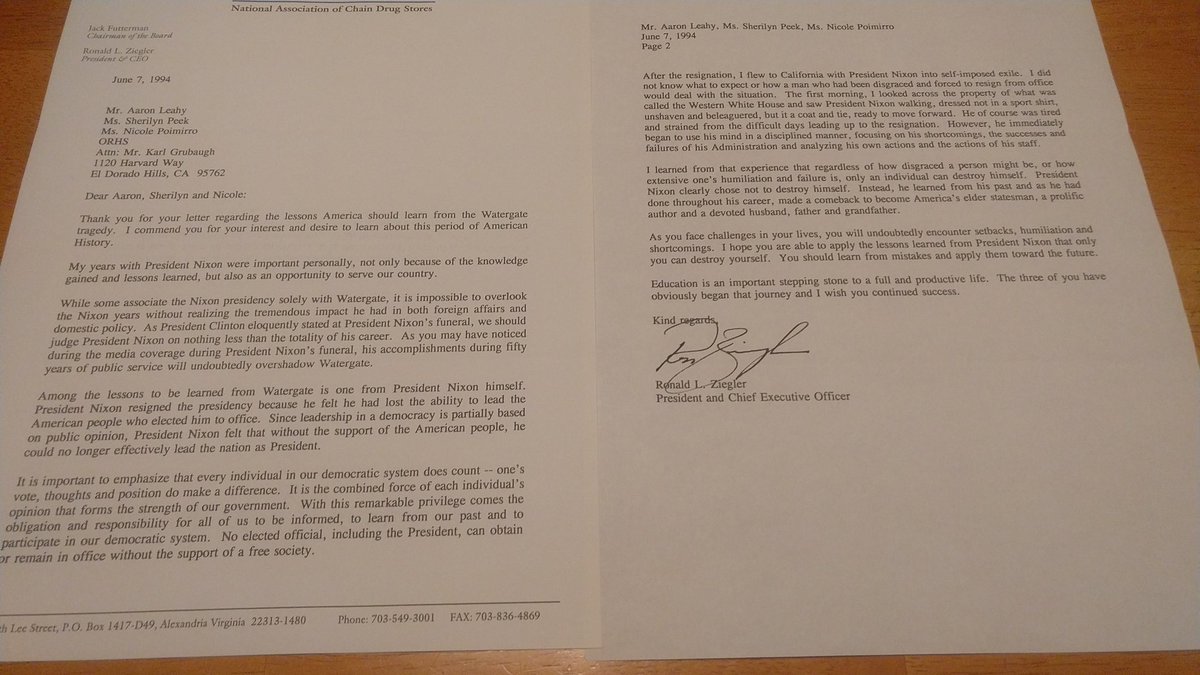
I had three bright students who were my TAs. The 20th anniversary of Richard Nixon's resignation was a few months away. I decided to have ... 1/

Before long, responses started to show up in my mailbox at school. 3/
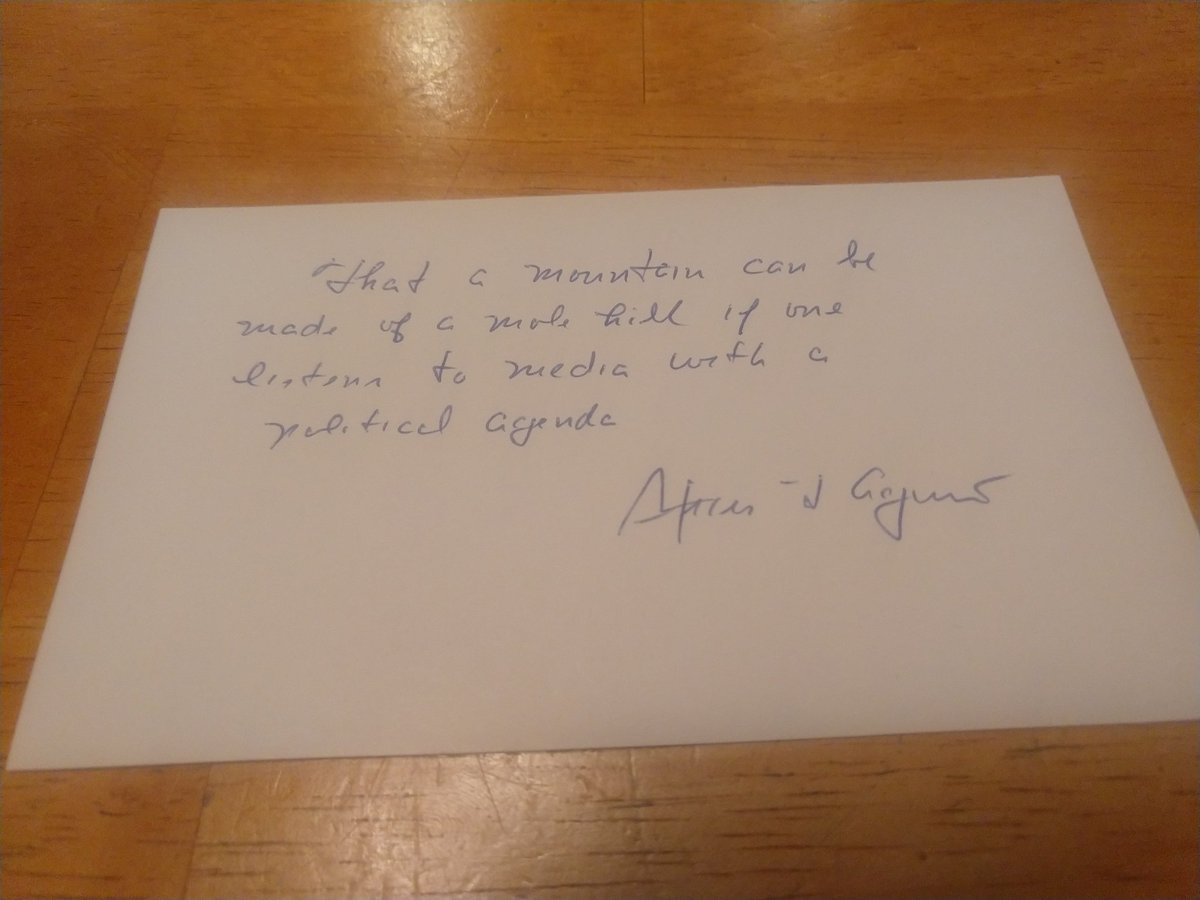
"That a mountain can be made of a mole hill if one listens to media with a political agenda." 23/
Because as we've seen these last four years, the wrong person in the presidency can be catastrophic.
I hope we learn the lesson this time.
25/end
More from Government


Remember the government wanting to "follow the science"? It is remarkable how far it is ignoring scientific advice on this new ultra-infectious variant of #Covid-19 by keeping schools open... both SAGE and @imperialcollege issuing warnings on school closures. Stay with me. /1
First the @imperialcollege paper, which finds that the new variant is still being ultra-infectious despite November lockdowns - link here, but cases of new variant trebled in SEast, even under lockdown /2
https://t.co/fdvuVX3OkW

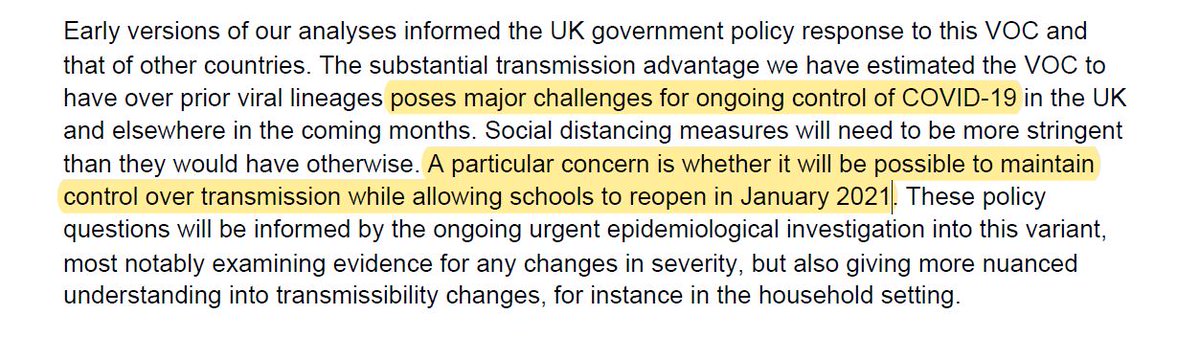
The paper then notes (given schools were open and under 20s are most infected): "A particular concern is whether it will be possible to maintain control over transmission while allowing schools to reopen in January 2021." /3
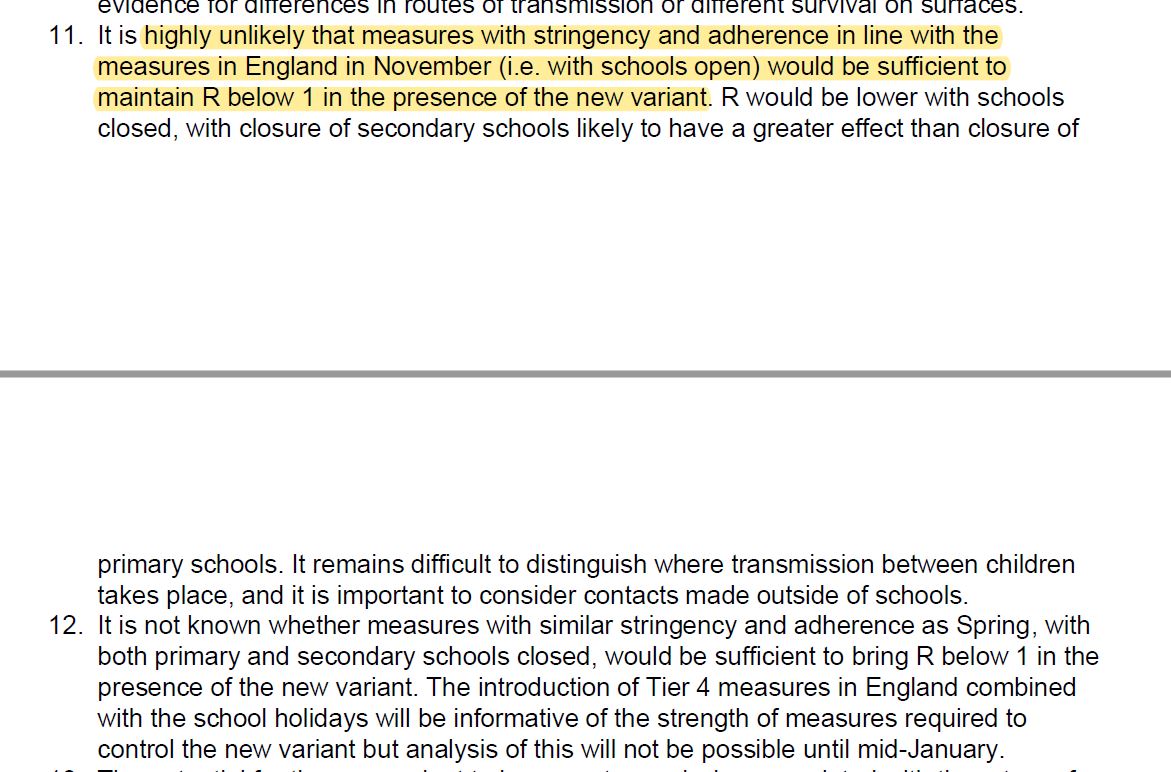
This echoes what govt science advisory SAGE cmme told ministers on Dec 22...that it was "highly unlikely" the R number can be kept below 1 (cases falling, it is currently 1.1-1.3) with schools open /4
https://t.co/yV5qcSkErJ
But on Dec 30 Gavin Williamson announce primaries would go back, and secondary schools would have staggered return while testing regime (lateral flow, not that sensitive) was set up - see statement here
First the @imperialcollege paper, which finds that the new variant is still being ultra-infectious despite November lockdowns - link here, but cases of new variant trebled in SEast, even under lockdown /2
https://t.co/fdvuVX3OkW
The paper then notes (given schools were open and under 20s are most infected): "A particular concern is whether it will be possible to maintain control over transmission while allowing schools to reopen in January 2021." /3
This echoes what govt science advisory SAGE cmme told ministers on Dec 22...that it was "highly unlikely" the R number can be kept below 1 (cases falling, it is currently 1.1-1.3) with schools open /4
https://t.co/yV5qcSkErJ
But on Dec 30 Gavin Williamson announce primaries would go back, and secondary schools would have staggered return while testing regime (lateral flow, not that sensitive) was set up - see statement here


You May Also Like

A THREAD ON @SarangSood
Decoded his way of analysis/logics for everyone to easily understand.
Have covered:
1. Analysis of volatility, how to foresee/signs.
2. Workbook
3. When to sell options
4. Diff category of days
5. How movement of option prices tell us what will happen
1. Keeps following volatility super closely.
Makes 7-8 different strategies to give him a sense of what's going on.
Whichever gives highest profit he trades in.
2. Theta falls when market moves.
Falls where market is headed towards not on our original position.
3. If you're an options seller then sell only when volatility is dropping, there is a high probability of you making the right trade and getting profit as a result
He believes in a market operator, if market mover sells volatility Sarang Sir joins him.
4. Theta decay vs Fall in vega
Sell when Vega is falling rather than for theta decay. You won't be trapped and higher probability of making profit.
Decoded his way of analysis/logics for everyone to easily understand.
Have covered:
1. Analysis of volatility, how to foresee/signs.
2. Workbook
3. When to sell options
4. Diff category of days
5. How movement of option prices tell us what will happen
1. Keeps following volatility super closely.
Makes 7-8 different strategies to give him a sense of what's going on.
Whichever gives highest profit he trades in.
I am quite different from your style. I follow the market's volatility very closely. I have mock positions in 7-8 different strategies which allows me to stay connected. Whichever gives best profit is usually the one i trade in.
— Sarang Sood (@SarangSood) August 13, 2019
2. Theta falls when market moves.
Falls where market is headed towards not on our original position.
Anilji most of the time these days Theta only falls when market moves. So the Theta actually falls where market has moved to, not where our position was in the first place. By shifting we can come close to capturing the Theta fall but not always.
— Sarang Sood (@SarangSood) June 24, 2019
3. If you're an options seller then sell only when volatility is dropping, there is a high probability of you making the right trade and getting profit as a result
He believes in a market operator, if market mover sells volatility Sarang Sir joins him.
This week has been great so far. The main aim is to be in the right side of the volatility, rest the market will reward.
— Sarang Sood (@SarangSood) July 3, 2019
4. Theta decay vs Fall in vega
Sell when Vega is falling rather than for theta decay. You won't be trapped and higher probability of making profit.
There is a difference between theta decay & fall in vega. Decay is certain but there is no guaranteed profit as delta moves can increase cost. Fall in vega on the other hand is backed by a powerful force that sells options and gives handsome returns. Our job is to identify them.
— Sarang Sood (@SarangSood) February 12, 2020

1/ 👋 Excited to share what we’ve been building at https://t.co/GOQJ7LjQ2t + we are going to tweetstorm our progress every week!
Week 1 highlights: getting shortlisted for YC W2019🤞, acquiring a premium domain💰, meeting Substack's @hamishmckenzie and Stripe CEO @patrickc 🤩
2/ So what is Brew?
brew / bru : / to make (beer, coffee etc.) / verb: begin to develop 🌱
A place for you to enjoy premium content while supporting your favorite creators. Sort of like a ‘Consumer-facing Patreon’ cc @jackconte
(we’re still working on the pitch)
3/ So, why be so transparent? Two words: launch strategy.
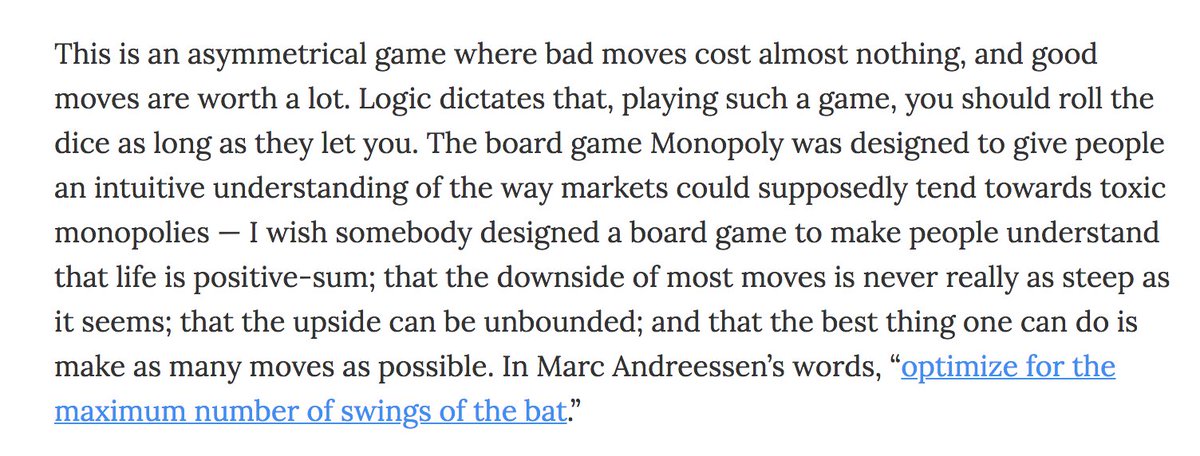
jk 😅 a) I loooove doing something consistently for a long period of time b) limited downside and infinite upside (feedback, accountability, reach).
cc @altimor, @pmarca
4/ https://t.co/GOQJ7LjQ2t domain 🍻
It started with a cold email. Guess what? He was using BuyMeACoffee on his blog, and was excited to hear about what we're building next. Within 2w, we signed the deal at @Escrowcom's SF office. You’re a pleasure to work with @MichaelCyger!
5/ @ycombinator's invite for the in-person interview arrived that evening. Quite a day!
Thanks @patio11 for the thoughtful feedback on our YC application, and @gabhubert for your directions on positioning the product — set the tone for our pitch!
Week 1 highlights: getting shortlisted for YC W2019🤞, acquiring a premium domain💰, meeting Substack's @hamishmckenzie and Stripe CEO @patrickc 🤩
2/ So what is Brew?
brew / bru : / to make (beer, coffee etc.) / verb: begin to develop 🌱
A place for you to enjoy premium content while supporting your favorite creators. Sort of like a ‘Consumer-facing Patreon’ cc @jackconte
(we’re still working on the pitch)
3/ So, why be so transparent? Two words: launch strategy.
jk 😅 a) I loooove doing something consistently for a long period of time b) limited downside and infinite upside (feedback, accountability, reach).
cc @altimor, @pmarca
4/ https://t.co/GOQJ7LjQ2t domain 🍻
It started with a cold email. Guess what? He was using BuyMeACoffee on his blog, and was excited to hear about what we're building next. Within 2w, we signed the deal at @Escrowcom's SF office. You’re a pleasure to work with @MichaelCyger!
5/ @ycombinator's invite for the in-person interview arrived that evening. Quite a day!
Thanks @patio11 for the thoughtful feedback on our YC application, and @gabhubert for your directions on positioning the product — set the tone for our pitch!


