It's the weekend!
Grab a cup of coffee, in this thread I will explain
1. What is a Yield Curve?
2. Why is it an important indicator of Recession?
3. Is an Economic Recession around the corner?
Lets dive right in!
A bond is a fixed income financial instrument which represents a loan made by an investor to a borrower
The investor typically receives payment in the form of interest and a lumpsum (principal) on maturity
The interest rate on a bond is known as coupon rate.
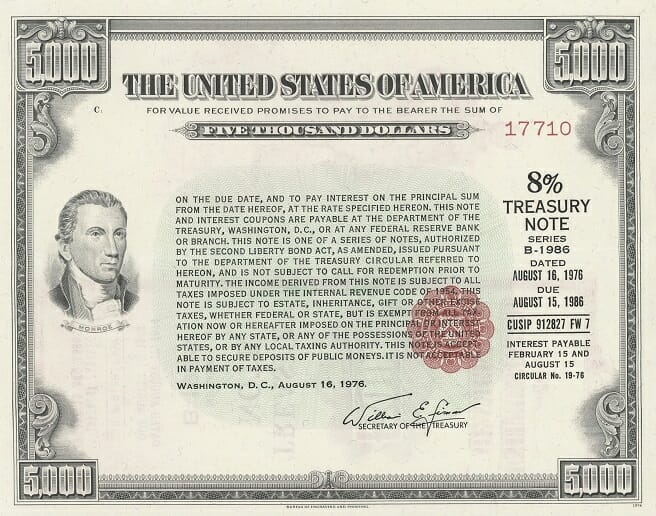
1. Zero Coupon : Pays both interest and principal at maturity
2. Sovereign Bonds : Issued by a Government or a Quasi Government Institution
3. Corporate Bonds : Issued by corporate like banks, established companies etc.
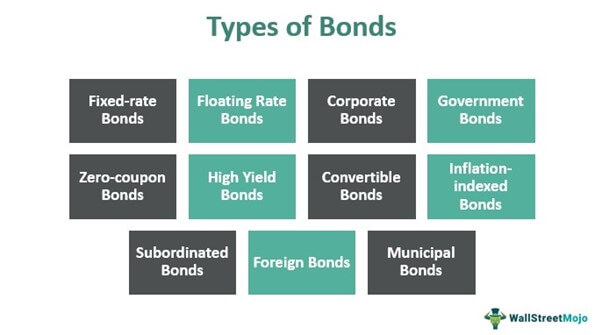
The higher the credit worthiness of the issuer, the lower the coupon rate
Credit Rating on a Bond is usually assigned by credit rating agencies like Moody's or Standard & Poor's (S&P)
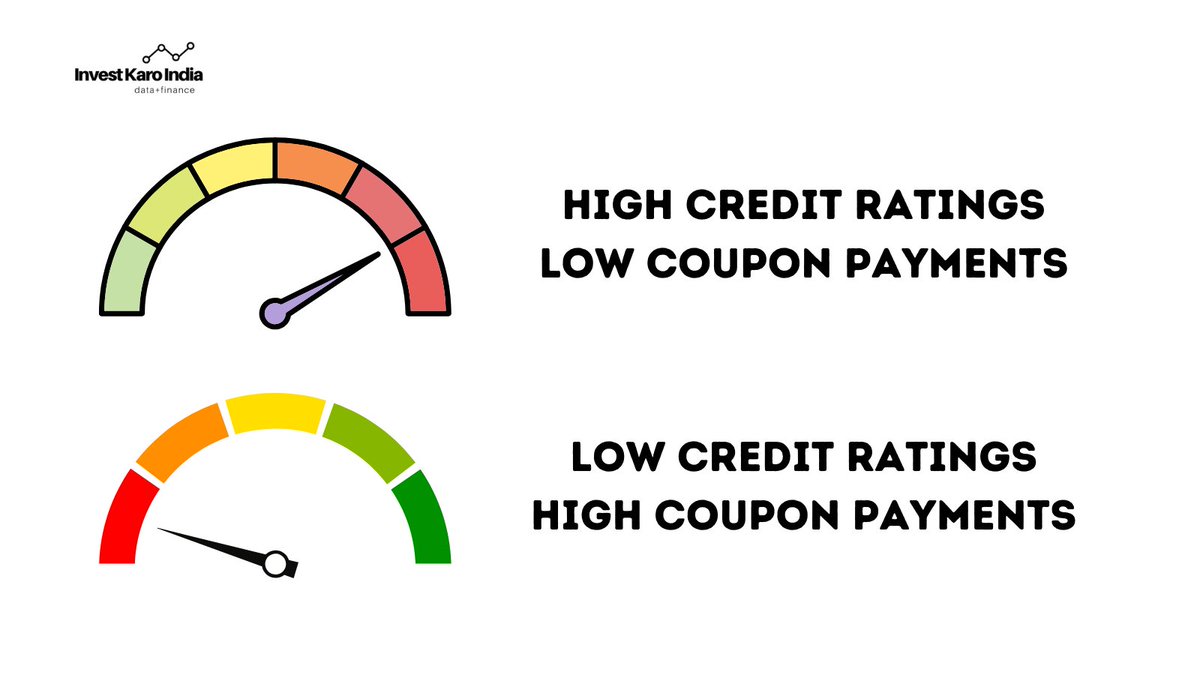
Anything with a credit rating of BBB (Triple B) or lower is considered as 'junk bond' or a 'high yield bond' as they have high risk of default
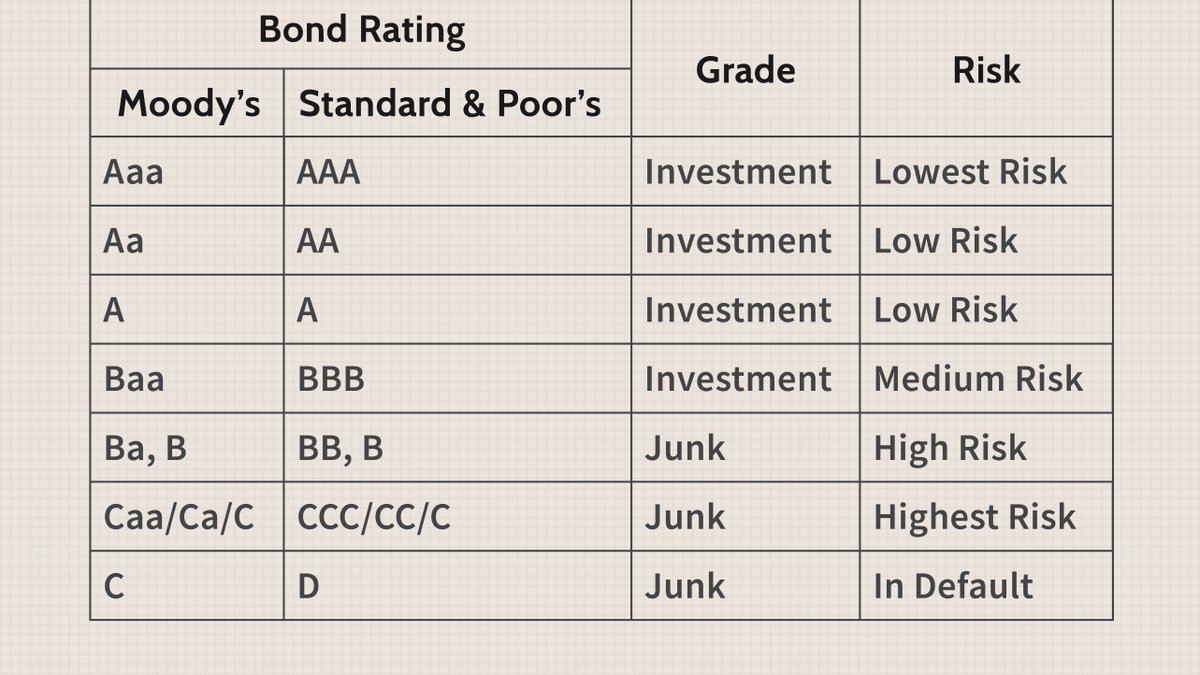
Yield is simply the return an investor of a bond realizes over the course of the bond holding period

Bond Yield = Interest Payments / Bond Price
Since, coupon (interest) payments on a bond along with tenure of a bond is fixed
your yield on a bond simply depends on the change in its price
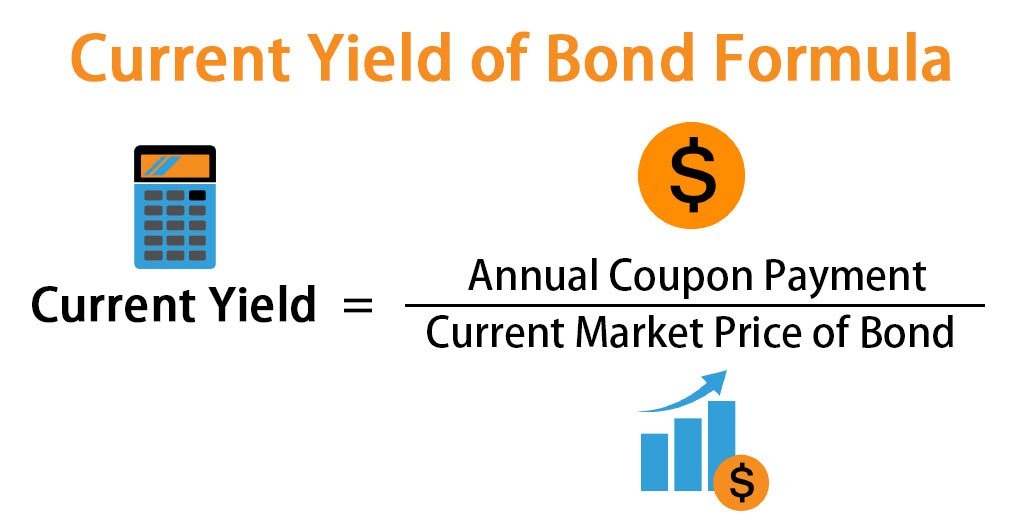
The logic and concept followed for calculation and estimating a Dividend Yield can be directly applied to a bond yield as well.
ITC as per its policy issues out 85% of its profits as Dividends to its Shareholders, this comes to around ~Rs 10/share
When ITC was trading
at 180/share, the Div. Yield was 5.5%
at 254/share, Div. Yield is 3.93%
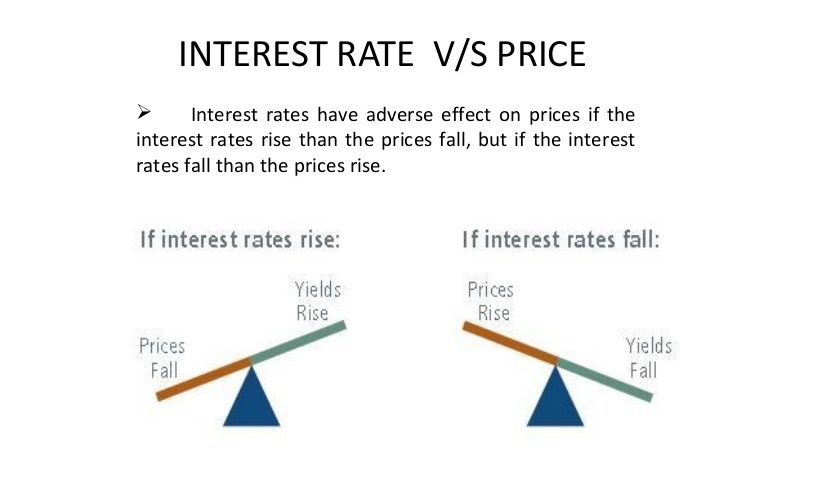
If Bond Price come down, the Yield on the bond will increase
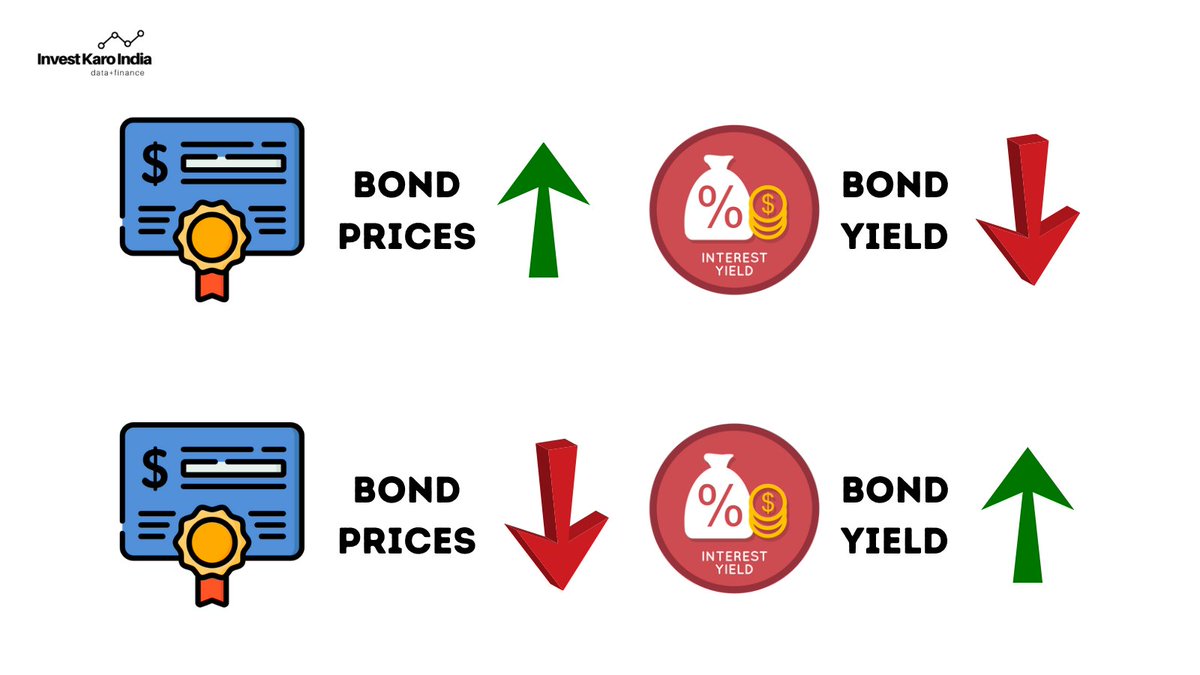
Suppose if you buy a 10 year Govt Bond that pays 5% interest yearly for Rs 1000
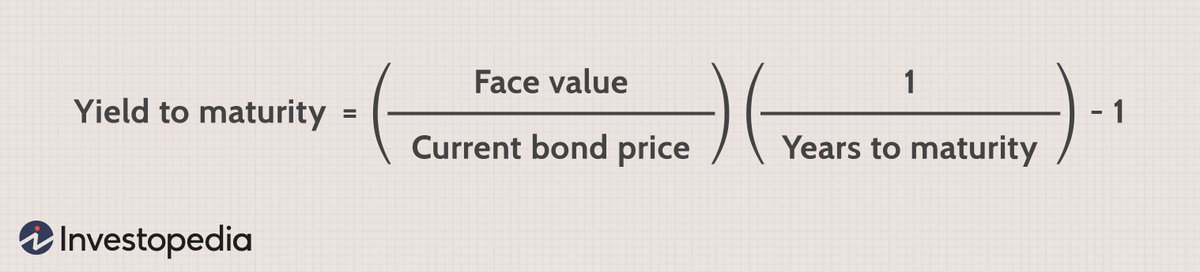
If instead of selling the bond when bond price rises to Rs 1100, you held on to your bond until its maturity date till end of 10 years
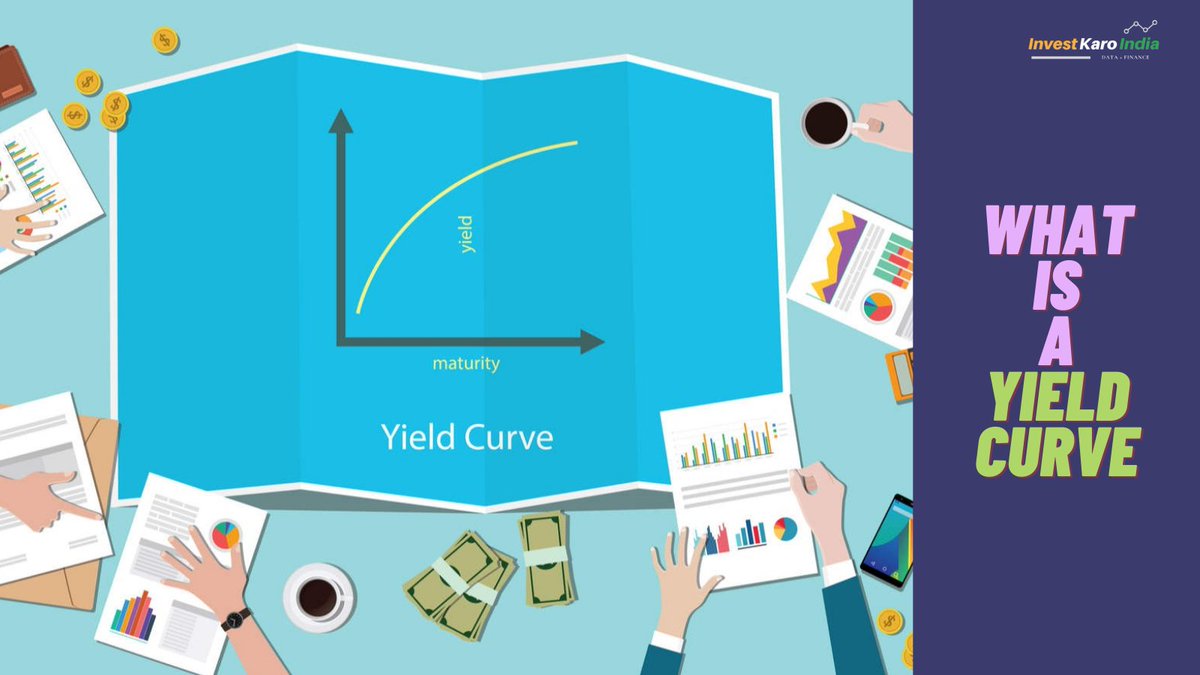
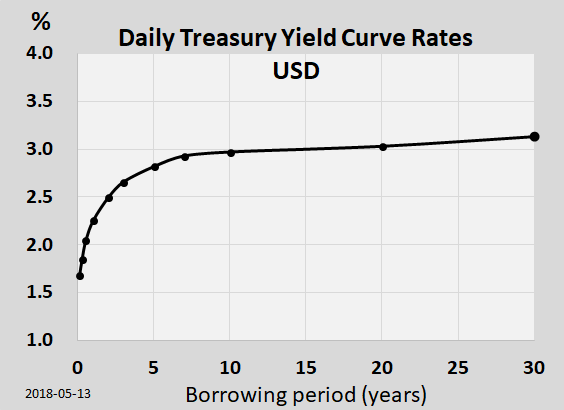
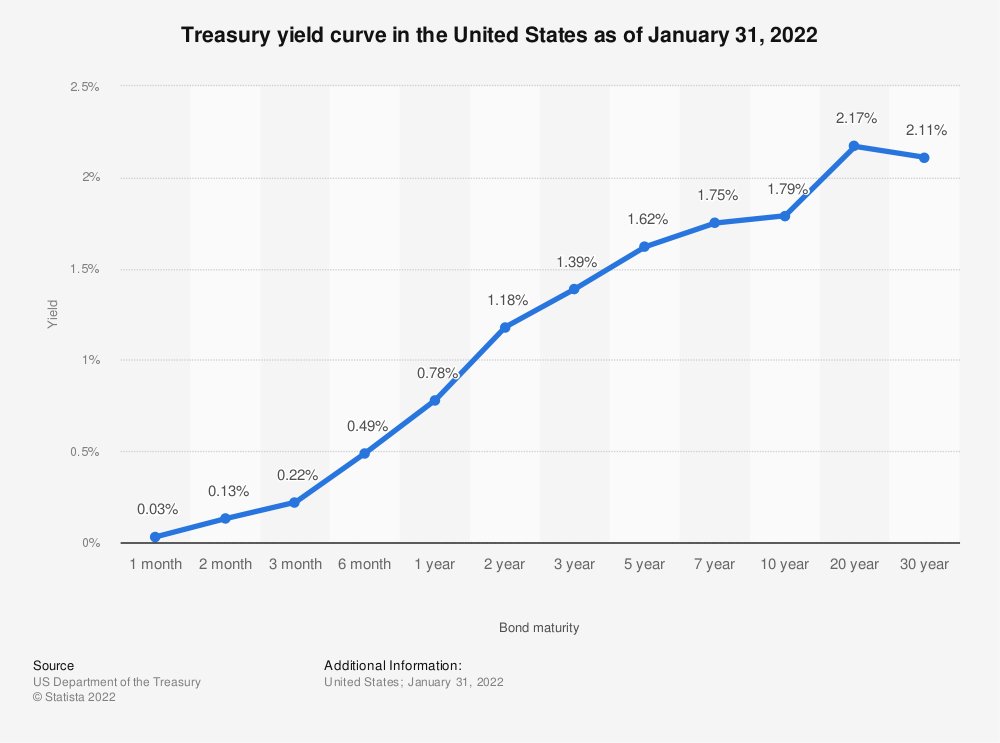
A Yield Curve is just a graphical representation of Yields of various bonds with similar credit rating but differing maturities
which depicts the Bond Yields on US Treasury Bonds for varying maturity dates ranging from 1 Month to 30 Years
Why is Yield Curve used to predict a Recession?

a. Upwards Sloping (Most of the Time)
b. Flat (Rare)
c. Inverted Yield Curve (Very Rare)
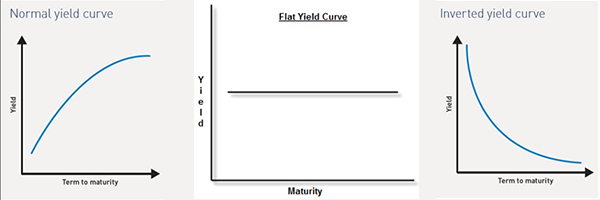
Yields on longer term bonds should be much higher compared to Yields on shorter term bonds
as
with longer term bonds you are taking more risk and hence need more interest as return

implying that near term risk in the economy is higher compared to long term
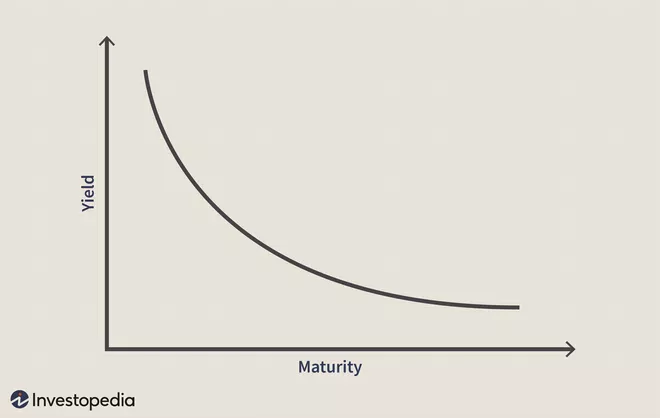
Bond Investors start dumping their short term bonds in favour for longer duration bonds
Demand for Short Term Bonds decreases, causing Bond Prices to collapse and Yields to Increase
While
Demand for Longer Term Bonds Increases, causing Bond Prices to rise and Yields to Decrease
Thus, creating the inverted Yield Curve.
Here are some of their publications on this subject
https://t.co/exRUKrkeYi
https://t.co/7dvY2PQOwE
https://t.co/iqxbeaqJg4
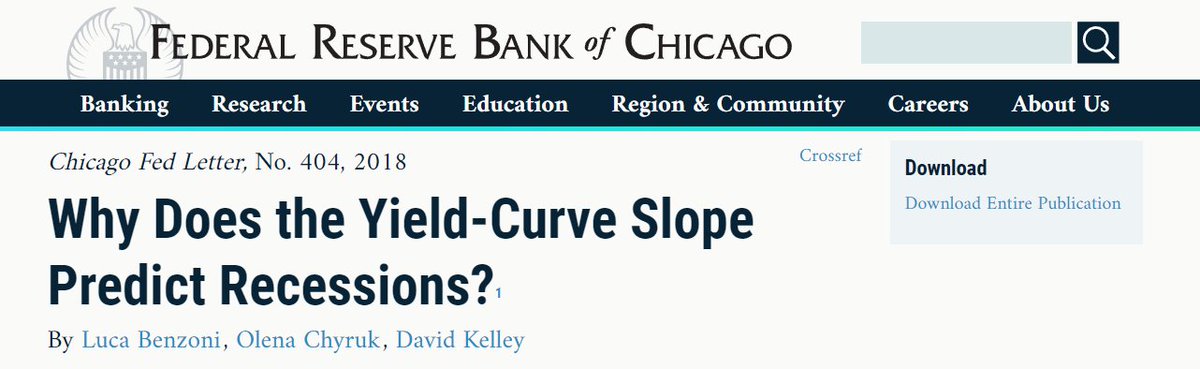
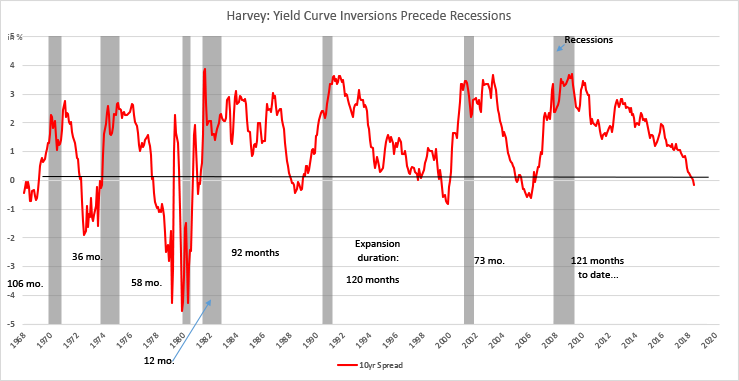
It even inverted right before the pandemic!
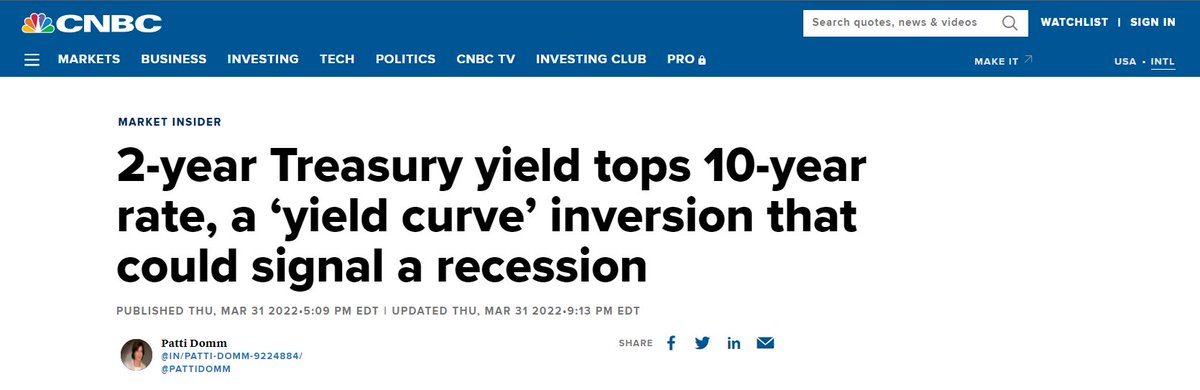
Most recently the US Treasury 2 and 10 yr Yield Curve Inverted on 29th March 2022
imply the onset of a recession anytime between end of 2022 to 2024.
Without Recessions, we wouldn't have the opportunity to reset and economy would overheat and turn into a bubble which when popped could bring depression.
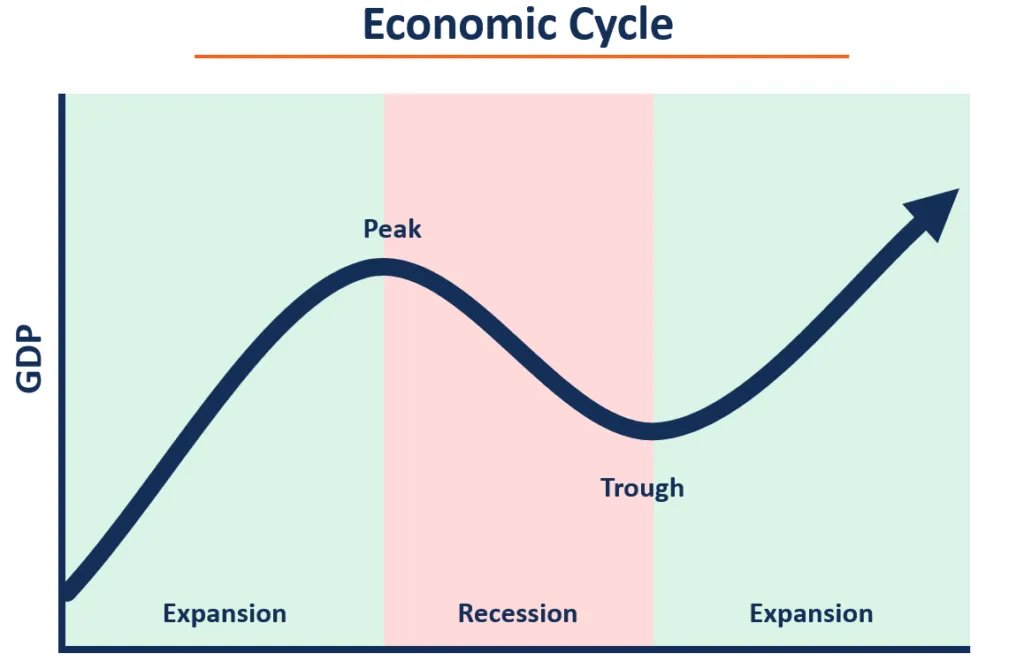
1. Slowing Economic Growth
2. High Unemployment Rate
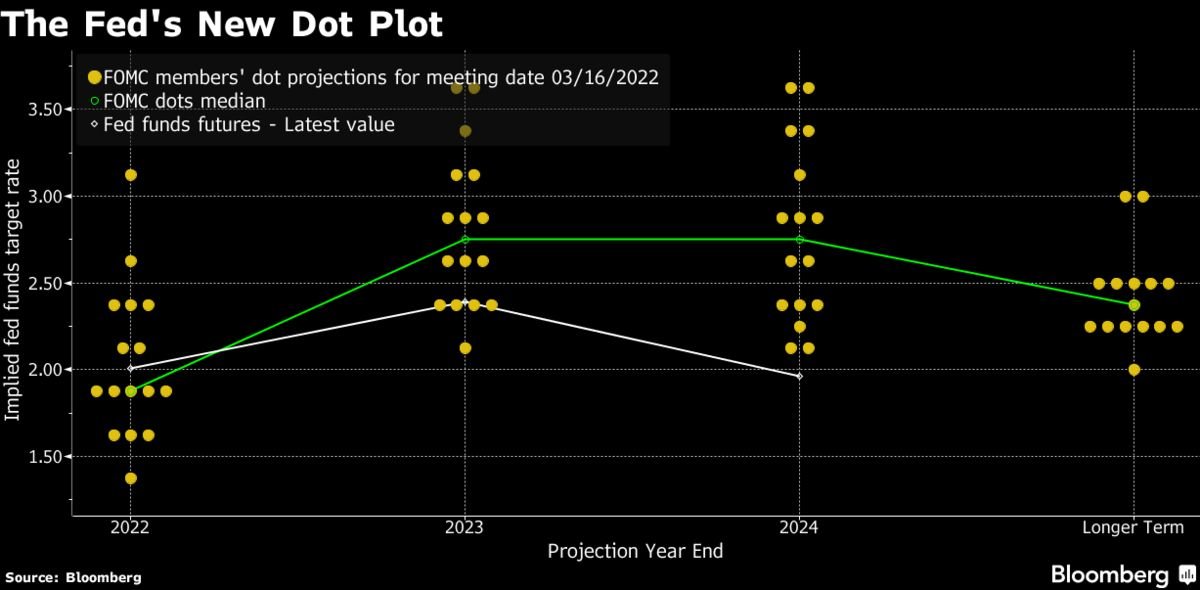
3. High to Medium Fed Interest Rates


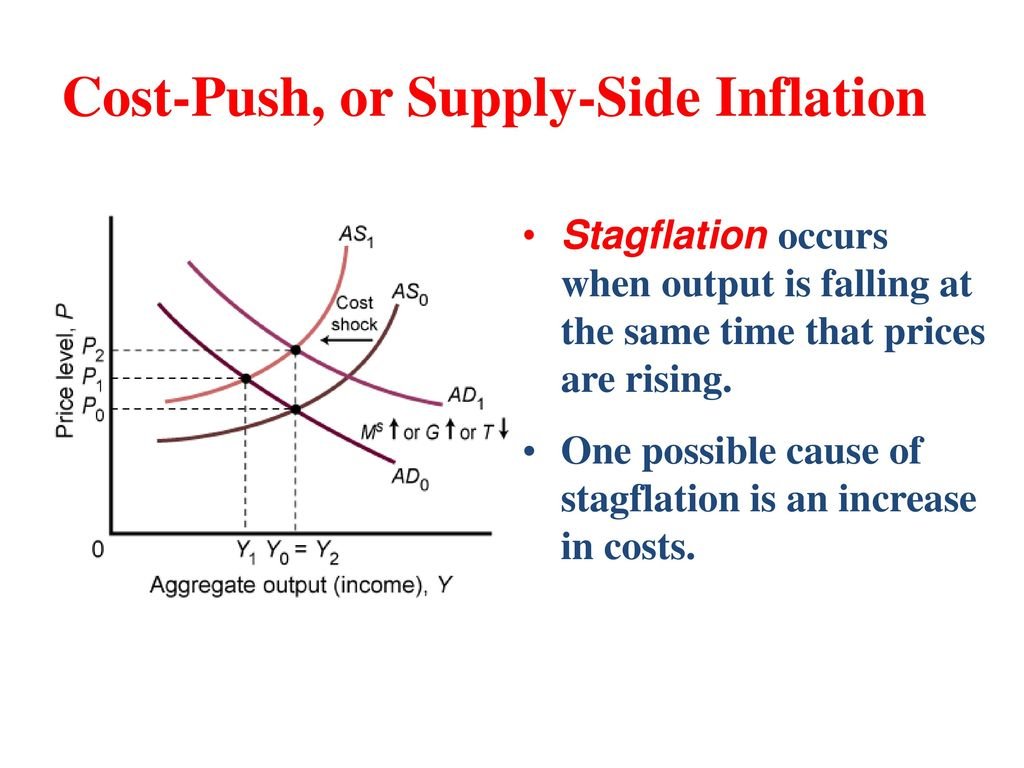
The inflation today is purely a result of supply side shortages cause by the onset of the pandemic
I don't know and I am not sure if anybody does.
I hope you've found this thread helpful. Follow me @itsTarH for more.
Please Like/Retweet the first tweet below if you can: https://t.co/2zDVPC7lus
It's the weekend!
— Tar \u26a1 (@itsTarH) April 2, 2022
Grab a cup of coffee, in this thread I will explain
1. What is a Yield Curve?
2. Why is it an important indicator of Recession?
3. Is an Economic Recession around the corner?
Lets dive right in! pic.twitter.com/7qrYbT6Scj
All my previous work, can be found here
https://t.co/LV5EyiqlCw
All my Threads so far \U0001f9f5 \U0001f447\U0001f3fc
— Tar \u26a1 (@itsTarH) June 5, 2021
https://t.co/3OwTRkY8BZ
Here is a 5 hour long webinar on Green and Renewable Energy ☀️
Lots of India, Chinese and US companies covered along with Global Demand and Supply scenario
https://t.co/rkiK2iHlS0

More from Tar ⚡
All my Threads so far 🧵 👇🏼
The One with the Cash Flow Explained
The One with Free Cash Flow Explained
The One with Mutual Funds
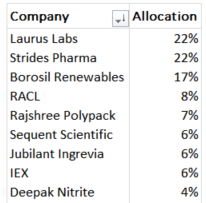
The One on Laurus Labs
The One with the Cash Flow Explained
It's the weekend!
— Tar \u26a1 (@itsTarH) May 15, 2021
Grab a cup of coffee, in this thread I will explain
1. What a cash flow statement is?
2. What does it tell you about a business?
3. How to analyze one?
Examples included various Indian companies.
Let's dive right in. pic.twitter.com/c8tNP26Z8K
The One with Free Cash Flow Explained
Its the weekend!
— Tar \u26a1 (@itsTarH) May 22, 2021
Grab a cup of coffee, in this thread I will explain
1. What is Capex?\U0001f4b0
2. What is Free Cash Flow? \U0001f4b8
3. What does Cash Flow from Investing and Cash Flow from Financing tells us? \U0001f4a1
Examples includes some famous companies.
Lets dive right in. pic.twitter.com/HDJgUvE8f8
The One with Mutual Funds
Its the weekend!
— Tar \u26a1 (@itsTarH) May 29, 2021
Grab a cup of coffee, in this thread I will explain
1. How to select a Mutual Fund?
2. Common and costly mistakes people make while choosing a Mutual Fund
3. Some tools and tips to help you while selecting a fund
Lets dive right in. pic.twitter.com/teelsojtn9
The One on Laurus Labs
Laurus Labs : A Visual Story
— Tar \u26a1 (@itsTarH) May 30, 2021
I am a Data Science / Machine Learning developer by profession and data along with finance are my two areas of competence.
I realize how powerful combining both of them can be, so here is a visual analysis for Laurus Labs.
Open Question to fellow investors tracking Music Industry.
A business like Universal which controls more than 1/3rd of all published music globally is selling for less than 6x FY20 Sales.
Why are Indian businesses like Saregama / Tips selling for 11x, 20x their sales?
If I include all of the revenue generated by entire firm, its selling for ~4.5x FY20 Sales
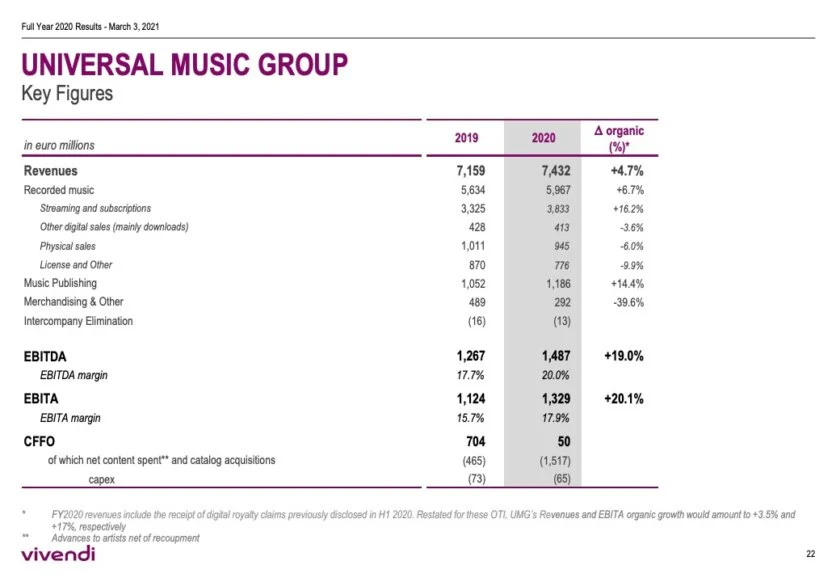
Universal Listing Market Cap ~ 40 Billion USD
FY 20 Revenues ~ 8.87 B USD or 7.4B EUR
Catalogue of Music includes every international artist you can possibly name
Either Universal is grossly undervalued or Saregama/Tips are grossly overvalued.
https://t.co/aHzWSYtcUt
https://t.co/v0EMoCuYKX
A business like Universal which controls more than 1/3rd of all published music globally is selling for less than 6x FY20 Sales.
Why are Indian businesses like Saregama / Tips selling for 11x, 20x their sales?
If I include all of the revenue generated by entire firm, its selling for ~4.5x FY20 Sales
Universal Listing Market Cap ~ 40 Billion USD
FY 20 Revenues ~ 8.87 B USD or 7.4B EUR
Catalogue of Music includes every international artist you can possibly name
Either Universal is grossly undervalued or Saregama/Tips are grossly overvalued.
https://t.co/aHzWSYtcUt
Homework for all the interested participants here:
— Intrinsic Compounding (@soicfinance) June 27, 2021
Q1.Why 20% and not 50%+ Margins for UMG
Q2. Differences in dynamics between Western&Indian cos?
Q3. Trends in West vs Trends in India in the industry.
Research and find the answers. My job is done \U0001f601\U0001f64f
https://t.co/v0EMoCuYKX
If you see the ebitda of universal music its low 20% compared to our saregama 30% or tips 50%. So when you compare earnings saregama is 40x and tips is 30x and universal music is 30x. Also these type of companies are less( low or no capex with excellent and growinh cashflows)
— Srikanth V (@mynameisnani75) June 27, 2021
Wanted to invest in US Stocks?
Next couple of months are good for bottom fishing
High growth stocks with sky high valuations will finally come down to Earth🌎
My shopping list includes the below
Planet Labs
Rocket Lab
Upstart
Coupang
QS
Roblox
Ginkgo Bioworks
High Risk 🅾️
Two frequent questions
1. What website to use for data?
https://t.co/8A7w6qX4VQ
2. How do
Ans'ing other Qs, don't know all the companies, there are too many to track & I stick with what I know
Don't feel FOMO, entire year high growth names will correct
Hunt for picks within recent SPACs, most are duds, but higher chances you find a
Next couple of months are good for bottom fishing
High growth stocks with sky high valuations will finally come down to Earth🌎
My shopping list includes the below
Planet Labs
Rocket Lab
Upstart
Coupang
QS
Roblox
Ginkgo Bioworks
High Risk 🅾️
Two frequent questions
1. What website to use for data?
https://t.co/8A7w6qX4VQ
2. How do
Ans'ing other Qs, don't know all the companies, there are too many to track & I stick with what I know
Don't feel FOMO, entire year high growth names will correct
Hunt for picks within recent SPACs, most are duds, but higher chances you find a