Newbie traders after learning F&O, look for paper trading platforms to practise. It's like the itch to swim after you learn swimming but end up in a baby pool. Experience of an adult pool vs a baby pool is different, likewise with the real markets & paper trading 🧵 (1/11)
Agreed, without experience, loading your trading account to the tilt and trading can be disastrous 🌋, but that does not mean you will have to paper trade forever. No matter how much you paper trade, you will never get the experience of trading (2/11)
When I talk about trading, I’m not just talking about experiencing the P&L rush. IMHO, experiencing the P&L and how it can vary in real-time is the last thing. There are multiple other things that you need to get comfortable with before diving into full-fledged trading 🏊♂️(3/11)
Stuff like placing limit/market order, GTT, AMO. Practising how SL-L for long & short positions works, trailing stops, figuring how margins work, M2M, T+1, T+2 settlements - the list is endless😩 with several moving parts. No paper trading platform gives you the real deal (4/11)
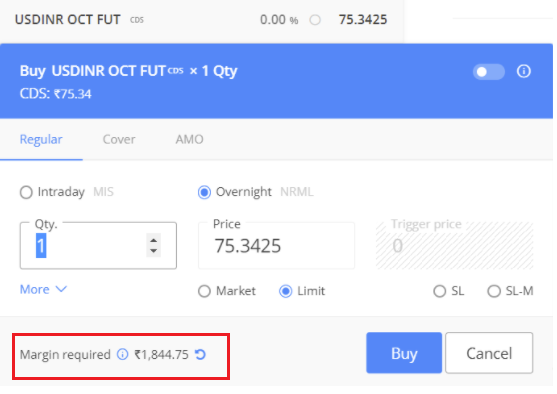
Here is a hack, though - instead of paper trading, try and place an actual trade on a low-value futures contract. My favourite is USD INR 💱, it costs just under 2K per contract, but gives you the whole trading experience (5/11)