3. The business is often worse than the seller will admit and can be improved more than the seller realizes.
I made my first SMB acquisition last Spring. Here are a few things I learned from the introduction until now:
1. Understanding the financial statements of a small business can be very different than what is taught in an MBA program
3. The business is often worse than the seller will admit and can be improved more than the seller realizes.
6. You'll lose sleep and won't even be able to identify the problem. It's just the pain of owning a business that keeps you up.
12. You'll get asked how many hours you work and you're never really off.
15. If you sign up to pay in net 30 then pay in net 30. Stretching payment terms isn't shrewd, it's dishonest.
More from Finance


THREAD: Who are the rising stars of Chinese elite politics in the central Party-State bureaucracy?
For @MacroPoloChina I analyzed last year's ministerial-level promotions to posts in Beijing
TLDR: Ties to Xi Jinping—or a Xi ally—are very helpful! (1/14)
https://t.co/kO2A0Efyq2
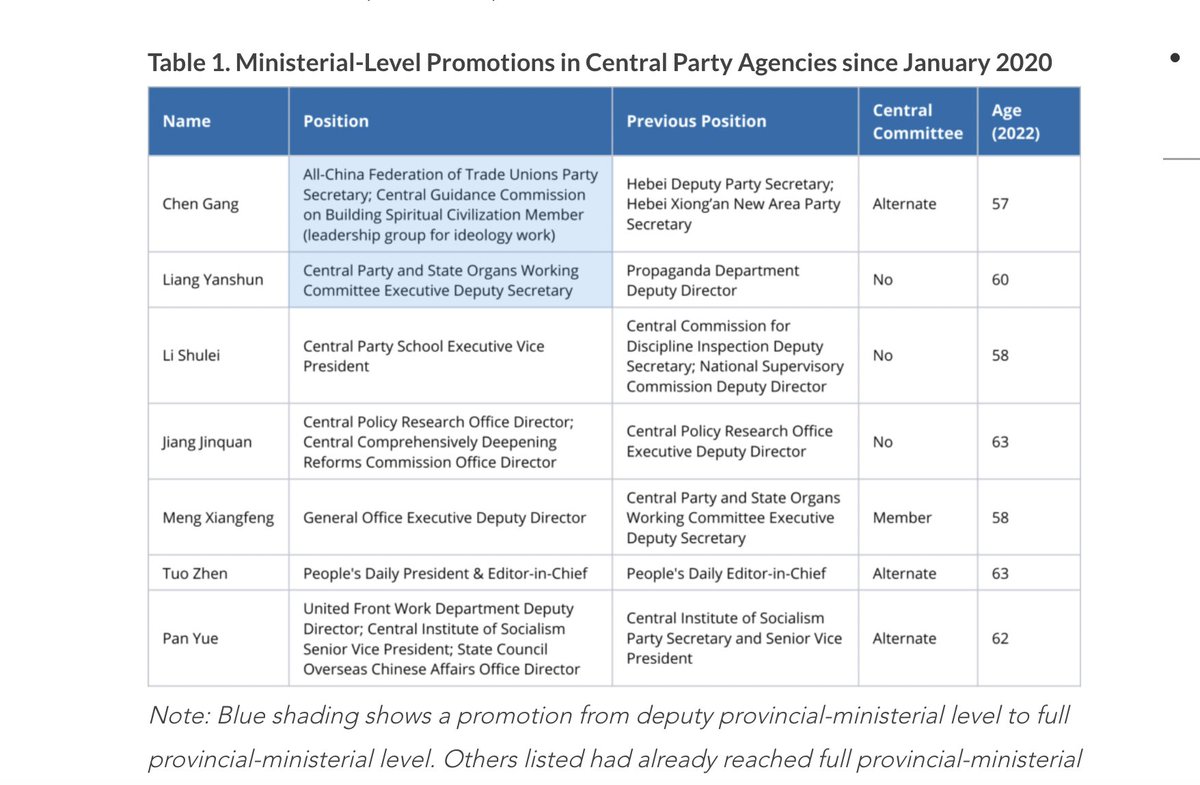
Seven politicians were promoted to ministerial-level positions in central Party agencies last year
All are likely to feature on the next Central Committee selected at the 2022 Party Congress
Some could make the CCP's elite 25-person Politburo (2/14)
https://t.co/kO2A0Efyq2

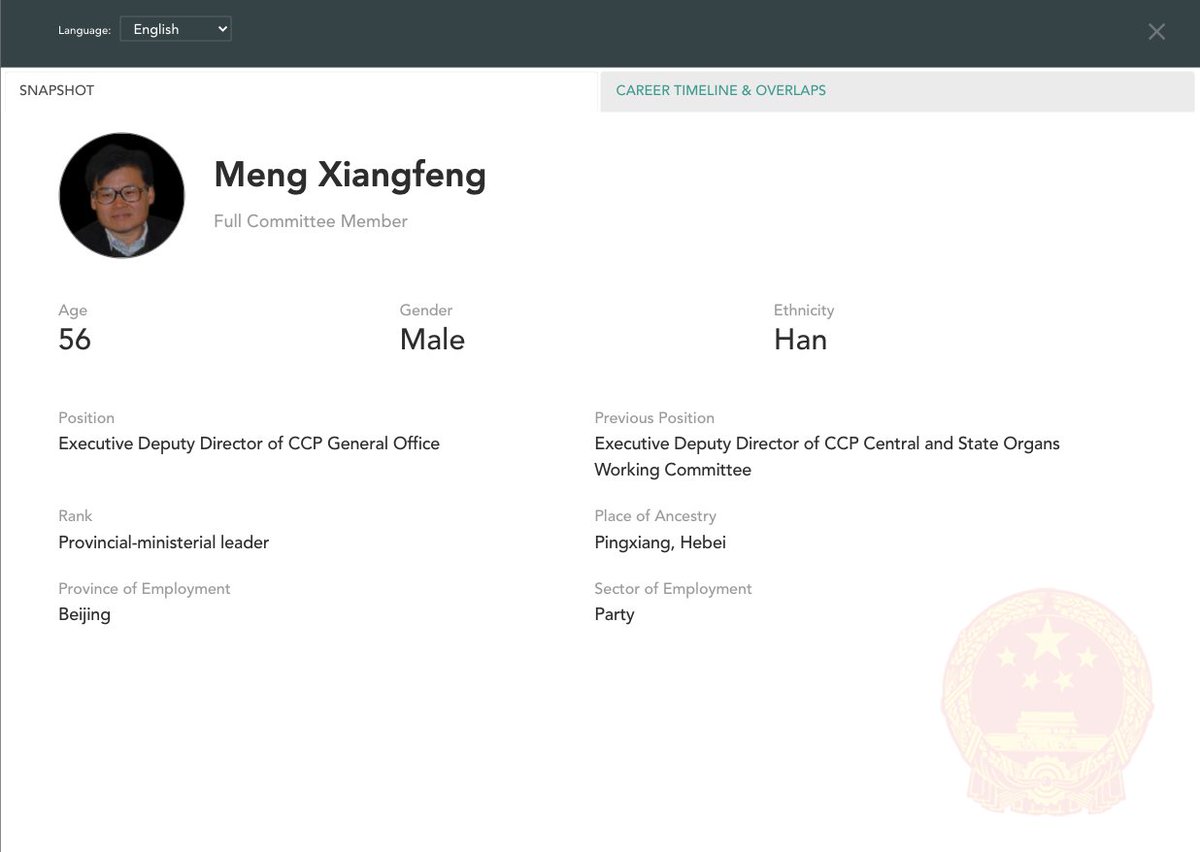
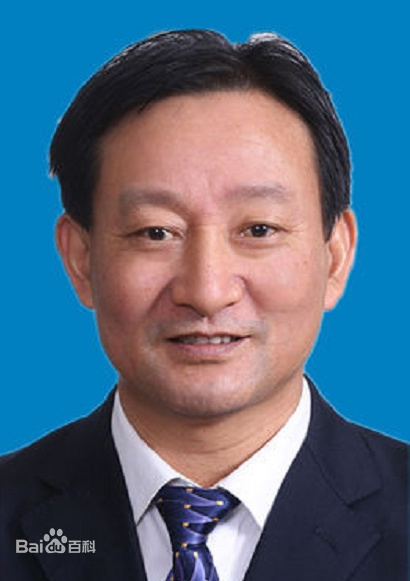
Likeliest for the Politburo is Meng Xiangfeng, new Executive Deputy Director of the CCP General Office
He would replace Xi ally Ding Xuexiang as CCP chief-of-staff if Ding is promoted further in 2022
Meng worked under Xi allies Cai Qi in Hangzhou and Chen Xi in Liaoning (3/14)
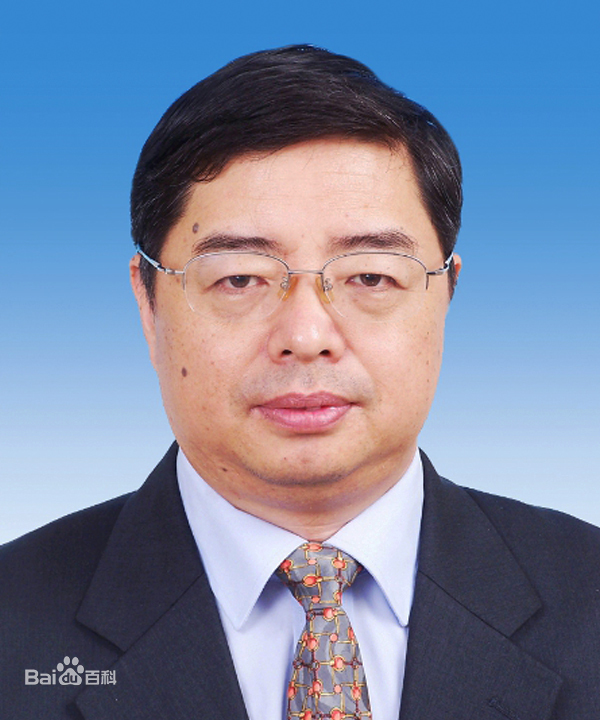
Less likely for the Politburo but still important is Jiang Jinquan, new Director of the CCP Policy Research Office
He replaces 5th-ranked leader Wang Huning who led the Party's brains trust for 18 years
Wang remains prominent and will be <68 in 2022, so he'll stay around (4/14)
Other notable central Party promotions include Li Shulei and Liang Yanshun, who both assisted Xi when he led the Central Party School from 2007-2012
Li is a political conservative who is said to be quite close with Xi, even drafting his 2014 speech on culture and art (5/14)
For @MacroPoloChina I analyzed last year's ministerial-level promotions to posts in Beijing
TLDR: Ties to Xi Jinping—or a Xi ally—are very helpful! (1/14)
https://t.co/kO2A0Efyq2
Seven politicians were promoted to ministerial-level positions in central Party agencies last year
All are likely to feature on the next Central Committee selected at the 2022 Party Congress
Some could make the CCP's elite 25-person Politburo (2/14)
https://t.co/kO2A0Efyq2
Likeliest for the Politburo is Meng Xiangfeng, new Executive Deputy Director of the CCP General Office
He would replace Xi ally Ding Xuexiang as CCP chief-of-staff if Ding is promoted further in 2022
Meng worked under Xi allies Cai Qi in Hangzhou and Chen Xi in Liaoning (3/14)
Less likely for the Politburo but still important is Jiang Jinquan, new Director of the CCP Policy Research Office
He replaces 5th-ranked leader Wang Huning who led the Party's brains trust for 18 years
Wang remains prominent and will be <68 in 2022, so he'll stay around (4/14)
Other notable central Party promotions include Li Shulei and Liang Yanshun, who both assisted Xi when he led the Central Party School from 2007-2012
Li is a political conservative who is said to be quite close with Xi, even drafting his 2014 speech on culture and art (5/14)

** MEGA THREAD ON Cryptocurrencies/Blockchain**
I wanted to know the best resources to learn about cryptocurrencies and blockchain for someone with zero knowledge. I asked Twitter, and Twitter answered.
This thread is a compilation of the best resources I was recommended. 👇👇
Let's start with ** BOOKS **
The first thing you should do before you pick up any book:
Learn about Bitcoin & Ethereum by reading the respective whitepapers.
- [Bitcoin white paper](https://t.co/cErOaFn6QL) by Satoshi Nakamoto
- [Ethereum White paper] (https://t.co/0g5kYCGJGq) by Vitalik Buterin
Even if you are not tech savvy, you can get a good grasp about how blockchain functions from these papers.
1) *The Basics of Bitcoins and Blockchains: An Introduction to Cryptocurrencies and the Technology that Powers Them* by Antony Lewis
This book covers topics such as the history of Bitcoin, the Bitcoin blockchain, and Bitcoin buying, selling, and mining.
It also answers how payments are made and how transactions are kept secure.
Other cryptocurrencies and cryptocurrency pricing are examined, answering how one puts a value on cryptocurrencies and digital tokens.
You May Also Like

Trump is gonna let the Mueller investigation end all on it's own. It's obvious. All the hysteria of the past 2 weeks about his supposed impending firing of Mueller was a distraction. He was never going to fire Mueller and he's not going to
Mueller's officially end his investigation all on his own and he's gonna say he found no evidence of Trump campaign/Russian collusion during the 2016 election.
Democrats & DNC Media are going to LITERALLY have nothing coherent to say in response to that.
Mueller's team was 100% partisan.
That's why it's brilliant. NOBODY will be able to claim this team of partisan Democrats didn't go the EXTRA 20 MILES looking for ANY evidence they could find of Trump campaign/Russian collusion during the 2016 election
They looked high.
They looked low.
They looked underneath every rock, behind every tree, into every bush.
And they found...NOTHING.
Those saying Mueller will file obstruction charges against Trump: laughable.
What documents did Trump tell the Mueller team it couldn't have? What witnesses were withheld and never interviewed?
THERE WEREN'T ANY.
Mueller got full 100% cooperation as the record will show.
BREAKING: President Donald Trump has submitted his answers to questions from special counsel Robert Mueller
— Ryan Saavedra (@RealSaavedra) November 20, 2018
Mueller's officially end his investigation all on his own and he's gonna say he found no evidence of Trump campaign/Russian collusion during the 2016 election.
Democrats & DNC Media are going to LITERALLY have nothing coherent to say in response to that.
Mueller's team was 100% partisan.
That's why it's brilliant. NOBODY will be able to claim this team of partisan Democrats didn't go the EXTRA 20 MILES looking for ANY evidence they could find of Trump campaign/Russian collusion during the 2016 election
They looked high.
They looked low.
They looked underneath every rock, behind every tree, into every bush.
And they found...NOTHING.
Those saying Mueller will file obstruction charges against Trump: laughable.
What documents did Trump tell the Mueller team it couldn't have? What witnesses were withheld and never interviewed?
THERE WEREN'T ANY.
Mueller got full 100% cooperation as the record will show.