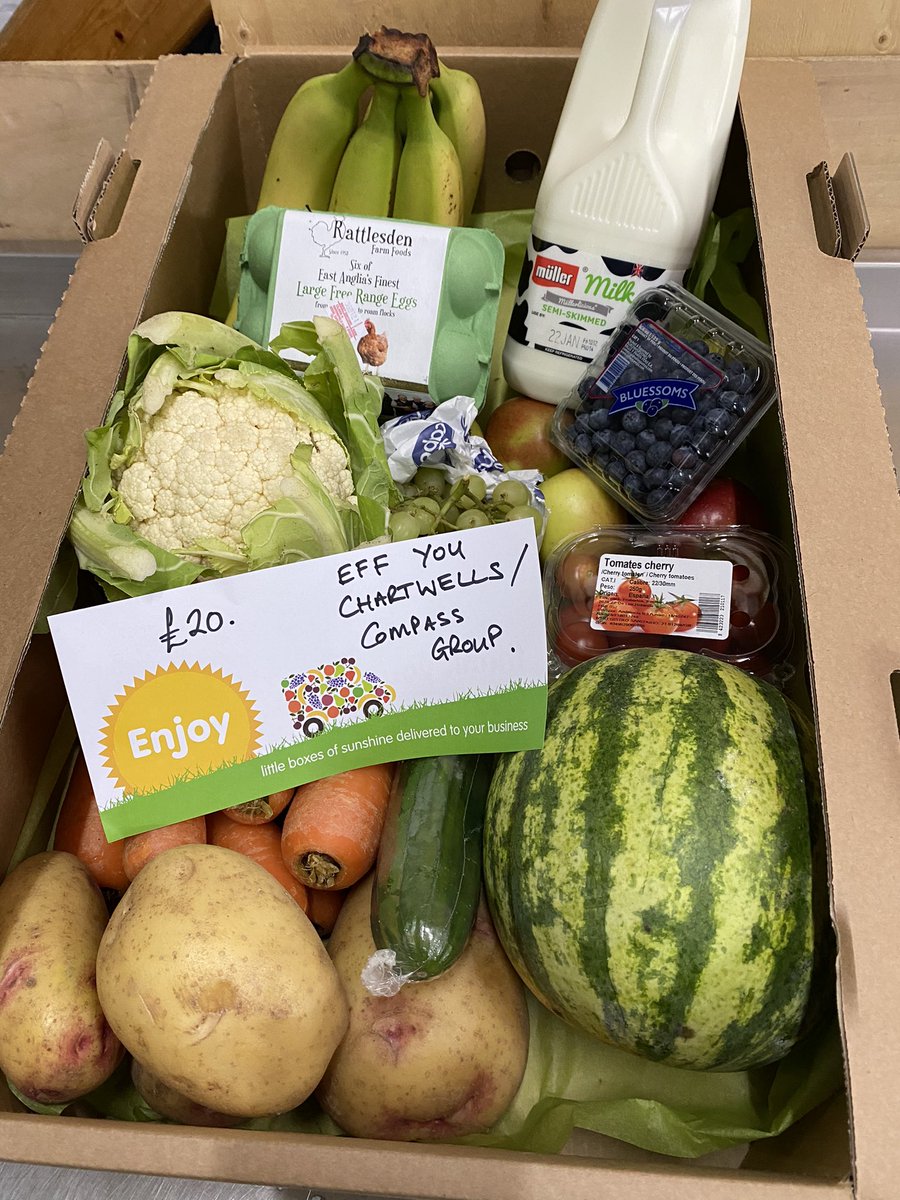
Hi all. I\u2019ve been sent LOTS of photos of the food parcels that have replaced the \xa330 vouchers and asked what I would do with them. I\u2019m replying with advice privately because to do so publicly would look like justifying these ill thought through, offensively meagre scraps /1.
— Jack Monroe (@BootstrapCook) January 11, 2021
Having made over 1000 boxes for vulnerable families in Cambridge via @RedHenCambridge (thanks to our customers 🙏🏽) My thoughts on the £30 box thing. Lots of factors at play here. 1/
-the cost of the box
-paying someone to fill it
-rent & rates
-& most expensive the *transport/distribution*
3/
It’s endemic in this industry & a shitty practice. 7/
But I do wonder what’s going on at the highest levels of govt. sending £5 of food to the poorest & charging £30 is outrageous. 8/
I politely told them to shove it. 🖕🏾

One last tweet from me.
Well I *did* say I wouldn’t swear any more. 🤷🏽♂️🤷🏽♂️🤷🏽♂️
#foodparcels

More from Finance


Inflation is coming, inflation is coming!
Last month I wrote about the distinction between long-term secular inflation and shorter-term cyclical inflation
It has been clear for several months that we are in the middle of a cyclical rise in
The full thread can be reviewed here:
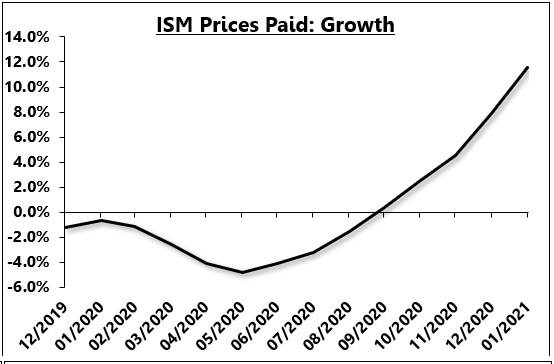
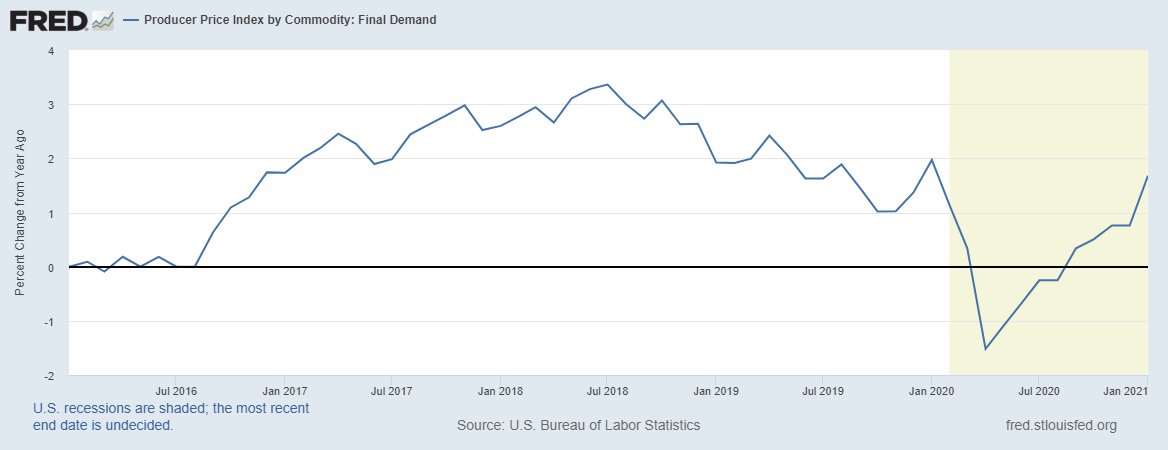
Today's PPI report should have been expected to surprise to the upside as the leading indicators of inflation have been screaming to the upside for months!
Here is the ISM prices paid index, cumulated into a growth rate
3/
Industrial commodity prices have also seen a major acceleration for months.
4/
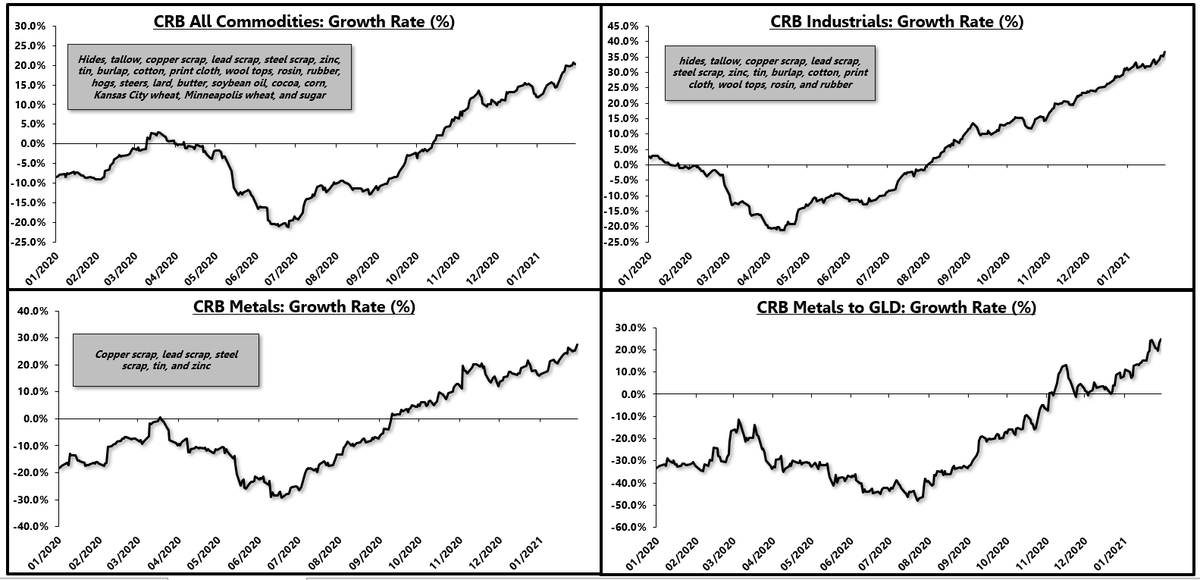
So today's PPI report was in line with the leads, suggesting that we have a cyclical upturn in inflation that is * primarily concentrated in the manufacturing sector *
This is a key point.
5/
Last month I wrote about the distinction between long-term secular inflation and shorter-term cyclical inflation
It has been clear for several months that we are in the middle of a cyclical rise in
Now, in the short-term, the manufacturing sector is red hot, driven by a pent-up demand rebound in goods consumption.
— Eric Basmajian (@EPBResearch) January 4, 2021
Commodity prices are screaming which gives legs to "goods" inflation in the short-term.
8) pic.twitter.com/rQcqHf1OD0
The full thread can be reviewed here:
Consensus continues to conflate the inflation story, mixing and matching long-term and short-term charts to fit what is generally a secular inflation narrative.
— Eric Basmajian (@EPBResearch) January 4, 2021
Here are my two cents to make the distinction clear.
1)
Today's PPI report should have been expected to surprise to the upside as the leading indicators of inflation have been screaming to the upside for months!
Here is the ISM prices paid index, cumulated into a growth rate
3/
Industrial commodity prices have also seen a major acceleration for months.
4/
So today's PPI report was in line with the leads, suggesting that we have a cyclical upturn in inflation that is * primarily concentrated in the manufacturing sector *
This is a key point.
5/