More from Finance


Thread: P&F Super Pattern
An effective price pattern defined using properties of P&F charts.
#Superpattern #Pointandfigure #Definedge
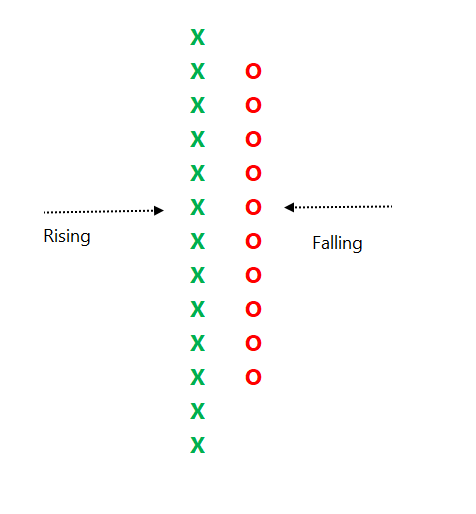
Point & Figure is an oldest charting method where price is plotted vertically, and the chart moves only when price moves. It is a different way of looking at the price, the objective box-value and reversal value offers advantage of identifying objective price patterns.
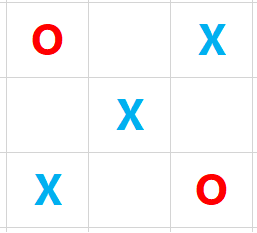
When price is moving up, it is plotted in a column of 'X'. When it is going down, it is plotted in a column of ‘O’. Normally, three-box reversal criteria is used to define the trend & reversal. Unlike a bar or candle, the P&F column can have multiple sessions in it.
Link to know more about the subject:
https://t.co/2xtLAVPBvm
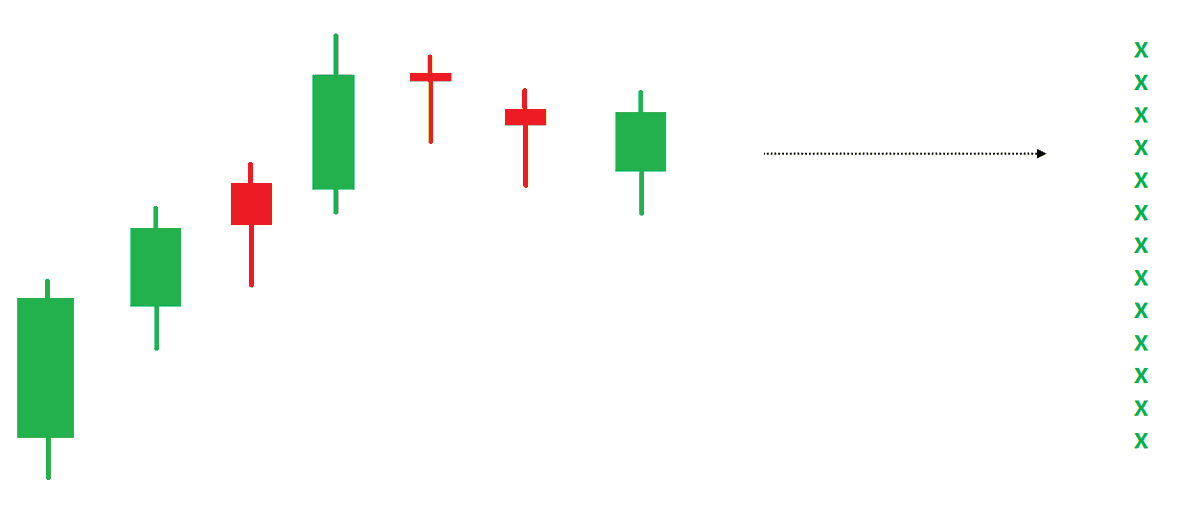
See below chart. Price is in a strong uptrend, P&F chart would produce a long of column of 'X' with more number of boxes in it.
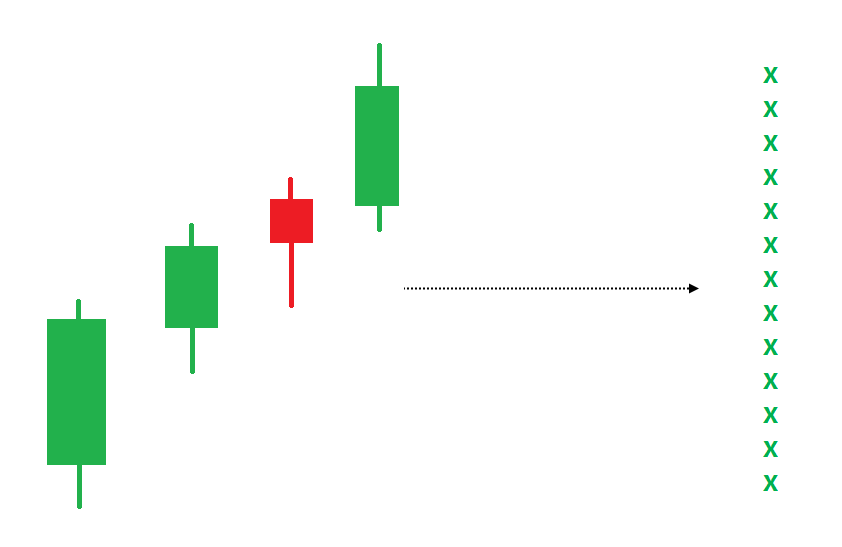
If such a trend is followed by some time bars without meaningful price correct, P&F chart would not move, and it will remain in column of 'X' in such a scenario.
An effective price pattern defined using properties of P&F charts.
#Superpattern #Pointandfigure #Definedge
Point & Figure is an oldest charting method where price is plotted vertically, and the chart moves only when price moves. It is a different way of looking at the price, the objective box-value and reversal value offers advantage of identifying objective price patterns.
When price is moving up, it is plotted in a column of 'X'. When it is going down, it is plotted in a column of ‘O’. Normally, three-box reversal criteria is used to define the trend & reversal. Unlike a bar or candle, the P&F column can have multiple sessions in it.
Link to know more about the subject:
https://t.co/2xtLAVPBvm
See below chart. Price is in a strong uptrend, P&F chart would produce a long of column of 'X' with more number of boxes in it.
If such a trend is followed by some time bars without meaningful price correct, P&F chart would not move, and it will remain in column of 'X' in such a scenario.


Ok here is the explanation. Grab a cup of coffee and read on. If you have not read/noticed this, you will see intraday options movement in a new light.
Say we have two options, one 50 delta ATM options and another 30 delta OTM option. Normally for a 100 point move, the ATM option will move 50 points and the OTM option will move 30 points. But in a high volatile environment, the OTM option will also move nearly 50 points
To understand why this happens, first understand why an ATM option is 50 delta. An ATM option has the probability of 50% of expiring as ITM. The price just has to close a rupee above the strike for the CE to be ITM and vice versa for PEs
Now think of a highly volatile day like today. If someone is asked where the BNF will close for the day or expiry, no one can answer. BNF can close freakin anywhere, That makes every option of an equal probability of being ITM. So all options have a 50% probability of being ITM
Hence, when a huge volatile move starts, all OTM options behave like ATM options. This phenomenon was first observed in the Black Monday crash of 1987 at Wall Street, which also gave rise to the volatility skew/smirk
In a high IV environment or when the market is very volatile
— Subhadip Nandy (@SubhadipNandy16) January 21, 2022
" OTM options will behave like ATM options", one will get almost the same delta movement
Say we have two options, one 50 delta ATM options and another 30 delta OTM option. Normally for a 100 point move, the ATM option will move 50 points and the OTM option will move 30 points. But in a high volatile environment, the OTM option will also move nearly 50 points
To understand why this happens, first understand why an ATM option is 50 delta. An ATM option has the probability of 50% of expiring as ITM. The price just has to close a rupee above the strike for the CE to be ITM and vice versa for PEs
Now think of a highly volatile day like today. If someone is asked where the BNF will close for the day or expiry, no one can answer. BNF can close freakin anywhere, That makes every option of an equal probability of being ITM. So all options have a 50% probability of being ITM
Hence, when a huge volatile move starts, all OTM options behave like ATM options. This phenomenon was first observed in the Black Monday crash of 1987 at Wall Street, which also gave rise to the volatility skew/smirk
You May Also Like

Tip from the Monkey
Pangolins, September 2019 and PLA are the key to this mystery
Stay Tuned!

1. Yang
2. A jacobin capuchin dangling a flagellin pangolin on a javelin while playing a mandolin and strangling a mannequin on a paladin's palanquin, said Saladin
More to come tomorrow!

3. Yigang Tong
https://t.co/CYtqYorhzH
Archived: https://t.co/ncz5ruwE2W

4. YT Interview
Some bats & pangolins carry viruses related with SARS-CoV-2, found in SE Asia and in Yunnan, & the pangolins carrying SARS-CoV-2 related viruses were smuggled from SE Asia, so there is a possibility that SARS-CoV-2 were coming from
Pangolins, September 2019 and PLA are the key to this mystery
Stay Tuned!
1. Yang
Meet Yang Ruifu, CCP's biological weapons expert https://t.co/JjB9TLEO95 via @Gnews202064
— Billy Bostickson \U0001f3f4\U0001f441&\U0001f441 \U0001f193 (@BillyBostickson) October 11, 2020
Interesting expose of China's top bioweapons expert who oversaw fake pangolin research
Paper 1: https://t.co/TrXESKLYmJ
Paper 2:https://t.co/9LSJTNCn3l
Pangolinhttps://t.co/2FUAzWyOcv pic.twitter.com/I2QMXgnkBJ
2. A jacobin capuchin dangling a flagellin pangolin on a javelin while playing a mandolin and strangling a mannequin on a paladin's palanquin, said Saladin
More to come tomorrow!
3. Yigang Tong
https://t.co/CYtqYorhzH
Archived: https://t.co/ncz5ruwE2W
4. YT Interview
Some bats & pangolins carry viruses related with SARS-CoV-2, found in SE Asia and in Yunnan, & the pangolins carrying SARS-CoV-2 related viruses were smuggled from SE Asia, so there is a possibility that SARS-CoV-2 were coming from