To attract more private investments from the big FMCGs like ITC [E-Choupal] and doubling Farmers income by 2022.
Farm Bill: EXPLAINED! [ITC Ltd. initiative of E-Chaupal]
@dmuthuk @nsitharamanoffc @shyamsek @Capital_Artist @amey_candor @arpit971
(Blog & a Summarized
To attract more private investments from the big FMCGs like ITC [E-Choupal] and doubling Farmers income by 2022.
- This Act allows farmers to sell their crops to any trader not necessarily to APMC. Before farmers used to sell at APMC but now it can sell it to anyone.
- It will also promote barrier free inter-state & intra-state trade and commerce outside the physical premises of market notified under state APLM
- Procurement at MSP will continue. Farmers can even sell to the government.
- Mandi will not stop functioning
- E-NAM will continue.
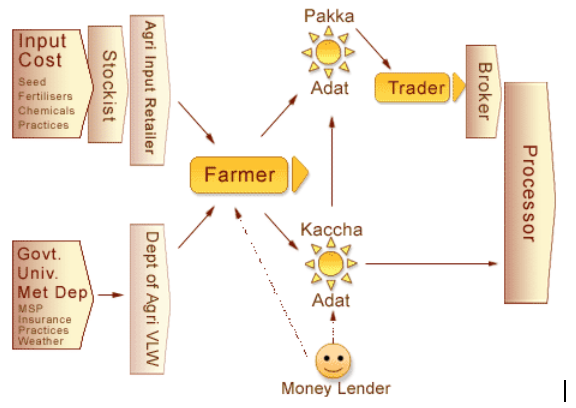
- Mainly focuses on Contract Farming for eg. ITC E-Choupal . As per legislation, “There will be Price Assurance to farmers even before sowing of crops
- There will local dispute redressal mechanism for the solving the issue of farmer.
- It is the initiative taken by the ITC Ltd which is specifically designed to tackle the challenges posed by the unique features of Indian agriculture, characterized by fragmented farms, weak infrastructure and the involvement of numerous intermediaries, among others
1. ITC Choupal Primary Education and Vocational Training
2. ITC Choupal Women's Empowerment Programme
3. ITC Choupal Livestock Development
4. ITC Choupal Watershed Development Programme
5. ITC Choupal Social & Farm Forestry programme
- It is an amendment of the previous EC act with the Provision to remove commodities like cereals, pulses, oilseeds, edible oils, onion and potatoes from the list of essential commodities.
- The freedom to produce will lead to harnessing economies of scale and attract the private sector into agriculture.
The Farmer are trapped in a vicious cycle of Low risk taking ability>low investment>low productivity>weak market orientation>low margin>low risk taking ability cycle.
It has made the whole sector uncompetitive despite rich natural resources.
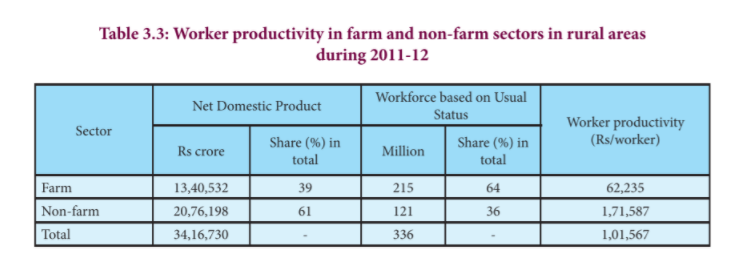
- Productivity of Farmers
In rural areas, agriculture employs 64% of the total workforce and contributes 39% of the total rural net domestic product. This shows over-dependence of the workforce on agriculture.
India has two main seasons Rabi and kharif which makes it possible to cultivate two crops a year on the same piece of land. with availability of new irrigation and new technology after the main kharif and after the main Rabi.
Doubling farmers income by 2022 implies that the major source of growth within agri sector are
- Improvement in productivity
- Resource use efficiency or saving in cost of production
- Increase in cropping intensity
- Diversification towards high value crops
More from The Tycoon Mindset

Framework on Buyback covered till now.
This Mega Thread covers our entire thesis on this buyback special situation play, across different sectors & our experience with it.
{Thread of Threads}
🧵👇
Basic of Buyback
Just Dial buyback experience & Notable Learning
Past Case Studies with different learning:
1. TCS Buyback
2. Gandhi Special tubes
This Mega Thread covers our entire thesis on this buyback special situation play, across different sectors & our experience with it.
{Thread of Threads}
🧵👇
Basic of Buyback
BASICS OF Buyback:
— The Tycoon Mindset (@tycoonmindset05) August 31, 2021
This thread is important for every investor who invest in Equity Market
Topics Covered:
1. What is Buyback?
2. Why buyback is important for every investor?
3. How to invest & participate in Buyback?
4. What not to do to avoid Buyback failure?
\U0001f9f5\U0001f447 pic.twitter.com/zR4XPpfU74
Just Dial buyback experience & Notable Learning
Buyback experience:
— The Tycoon Mindset (@tycoonmindset05) September 22, 2020
JustDial buyback just ended. We made a return of ~47% in a quarter by following our Buyback Strategy & technical analysis@gauravgsgs @NeerajMarathe @Prashanth_Krish @mysticfuture @MysticWealth11 @suru27 @tapak7 @stockifi_Invest
Thread of Buyback Play\U0001f447\U0001f9f5
Past Case Studies with different learning:
1. TCS Buyback
Releasing our another piece of buyback analysis on TCS.
— The Tycoon Mindset (@tycoonmindset05) October 11, 2020
Summarizing our article for anyone who wants to have a quick look in our further thread.@shyamsek @SumitResearch @Prakashplutus @tapak7@SanaSecurities @Maaachaaa69 https://t.co/m83G9JZAtN
2. Gandhi Special tubes
Gandhi Special Tubes has come up with buyback at a price of Rs 550. Buyback is ~5% of the total capital.
— The Tycoon Mindset (@tycoonmindset05) July 7, 2021
With higher retail shareholder and promoter participation, Buyback is still lucrative.
Read here, about what's intriguing in this buyback play \U0001f447\U0001f600https://t.co/iKe25GTaYo