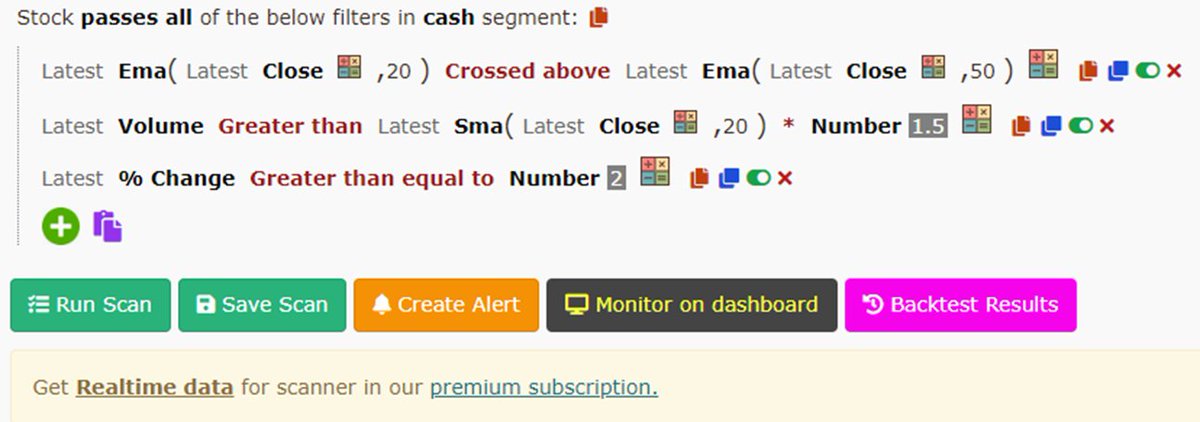
🔸 It scans stocks by using technical indicators like RSI, MACD, divergences, etc.
🔸 It also uses fundamental tools like Book Value, EPS,PE etc
[2/15]


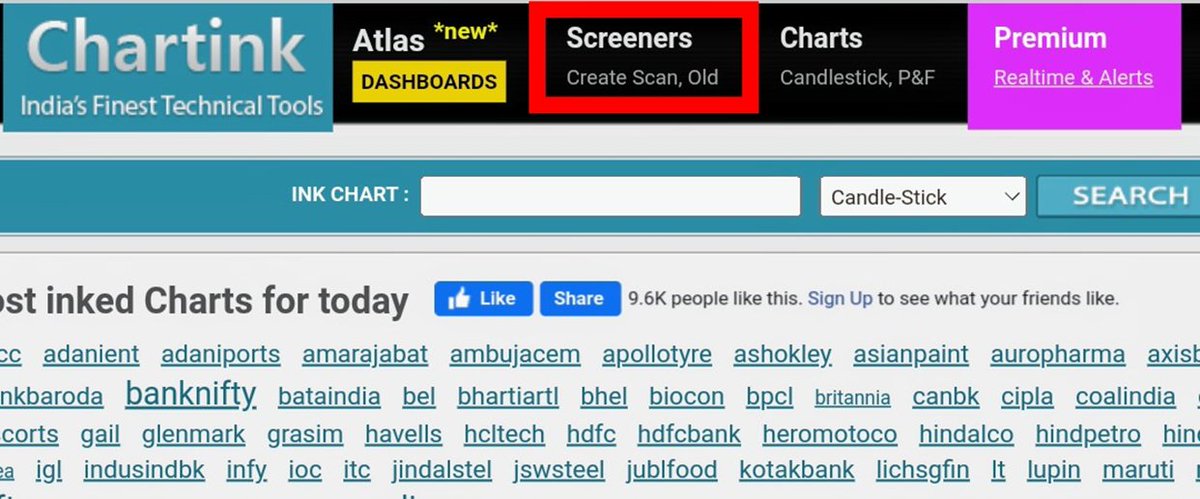
\U0001d5db\U0001d5fc\U0001d604 \U0001d601\U0001d5fc \U0001d5f0\U0001d5ff\U0001d5f2\U0001d5ee\U0001d601\U0001d5f2 \U0001d606\U0001d5fc\U0001d602\U0001d5ff \U0001d5fc\U0001d604\U0001d5fb \U0001d5d6\U0001d5f5\U0001d5ee\U0001d5ff\U0001d601\U0001d5f6\U0001d5fb\U0001d5f8 \U0001d5e6\U0001d5f0\U0001d5ff\U0001d5f2\U0001d5f2\U0001d5fb\U0001d5f2\U0001d5ff
— JayneshKasliwal (@JayneshKasliwal) August 25, 2022
\U0001f9f5 Thread \U0001f9f5
[1/15]
Price Action Trading ( Without Indicators)
— Learn to Trade (@learntotrade365) August 20, 2022
Intraday Trading strategy for all Directional traders.
Intraday Trading Strategy Thread \U0001f9f5
Support us by RETWEET to reach and benefit maximum traders
Scroll down \U0001f447 pic.twitter.com/AVsKmWroMc
Vwap with Pivot Points
— Learn to Trade (@learntotrade365) August 14, 2022
Intraday Trading strategy for Trend followers ( Will share also for mean reversion trader as soon as possible )
Intraday Trading Strategy Thread \U0001f9f5
Support us by Retweet to reach and benefit maximum traders
Scroll down \U0001f447 pic.twitter.com/xYPPnqWQ02
Buyers vs Sellers
— Learn to Trade (@learntotrade365) August 13, 2022
A simple technique to understand the index direction using candlesticks chart.
Intraday Trading Thread \U0001f9f5
Retweet to reach & benefit maximum traders
Scroll down \U0001f447 pic.twitter.com/6vMK92EqDo