Are you looking for a successful intraday trading strategy in Banknifty?
Well here is one along with entry, exit rules, and backtested results!
More from Indrazith Shantharaj

A Gap Open is a Big Headache for Intraday Traders.
Nowadays everyday market is opening with big gaps.
Solution?
Shifting to Stocks!
But How to Pick Good Stocks for Tomorrow's Trading?
Presenting 11 FREE Screeners to scan Stocks for the Next Trading Day!
Thread 🧵
(1/N)

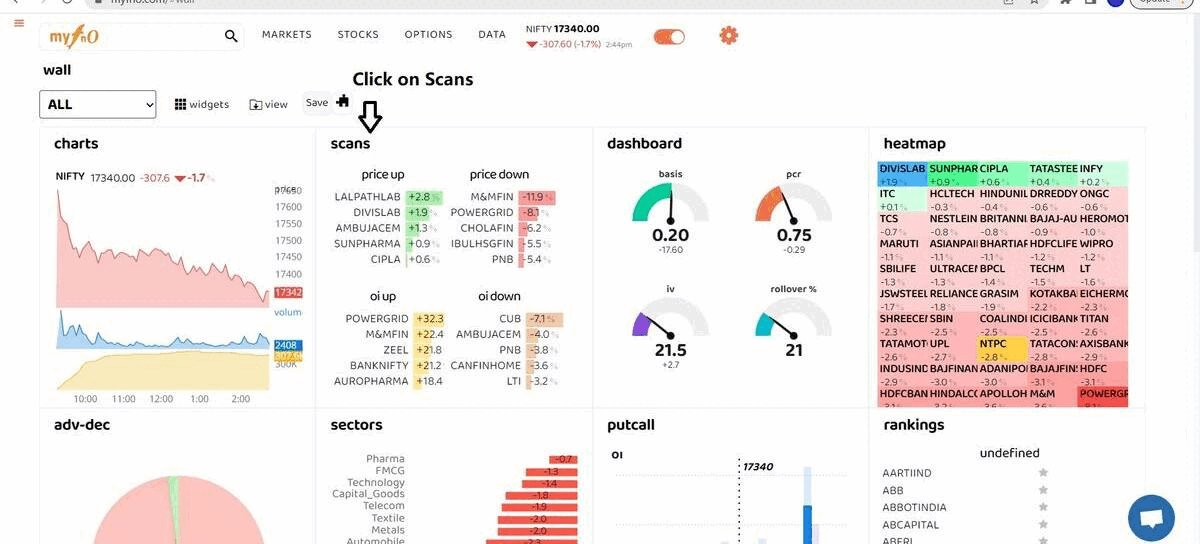
MYFNO - To Know the Stocks Which Received High and Low Open Interest (OI)
https://t.co/FURZDTArKK
(2/N)
Shortlist Bullish Momentum Stocks
This Screener shortlists all the bullish momentum stocks from NSE for the next day's trading (based on price action).
https://t.co/3teN7JLDMs
(3/N)
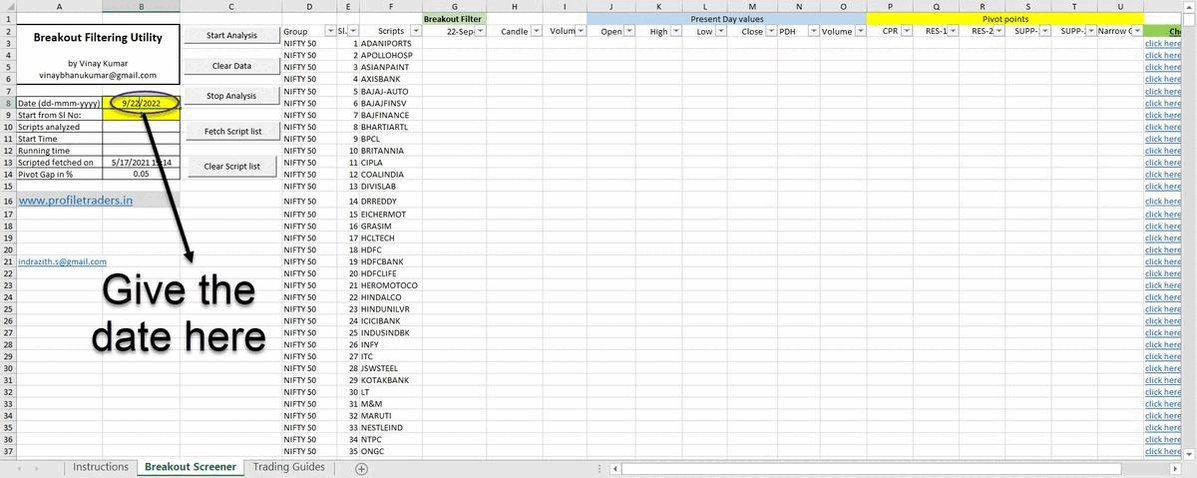
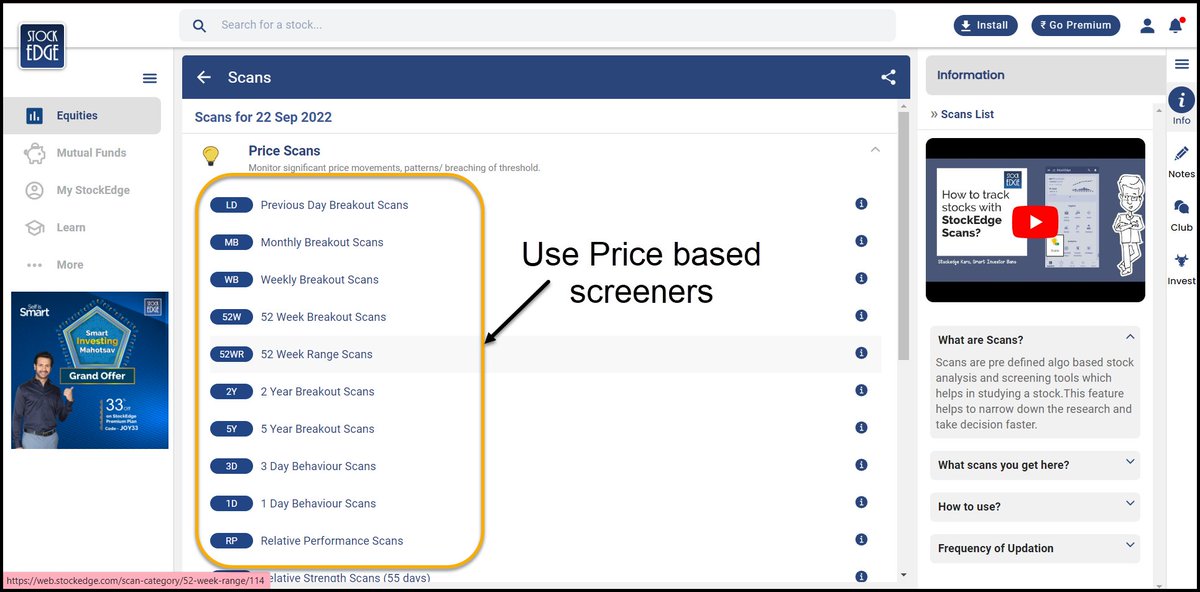
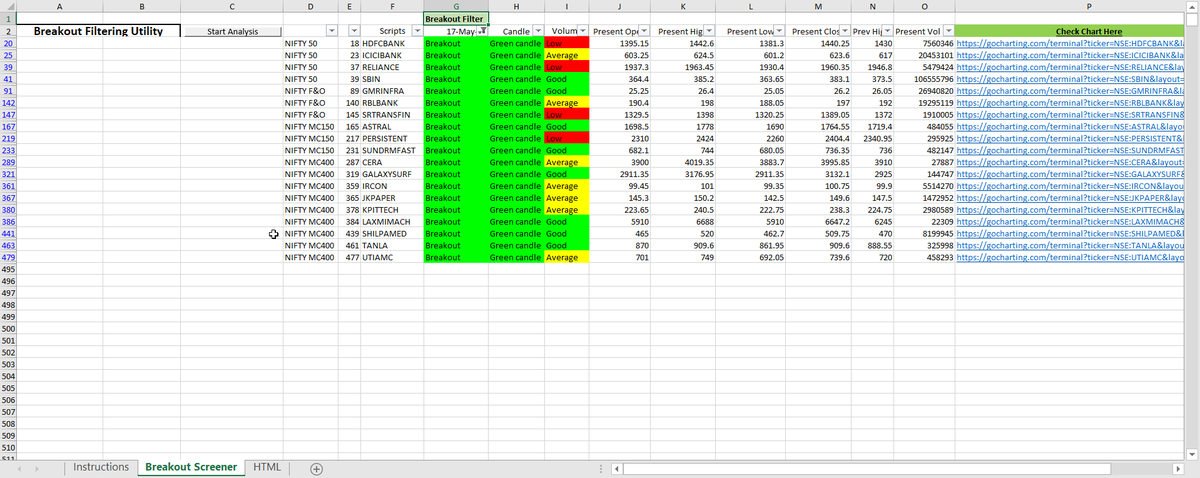
Screeners Based on Price (ex: Previous Day Breakout, Weekly Breakout, Monthly Breakout, etc.)
https://t.co/Y5naQIx967
(4/N)
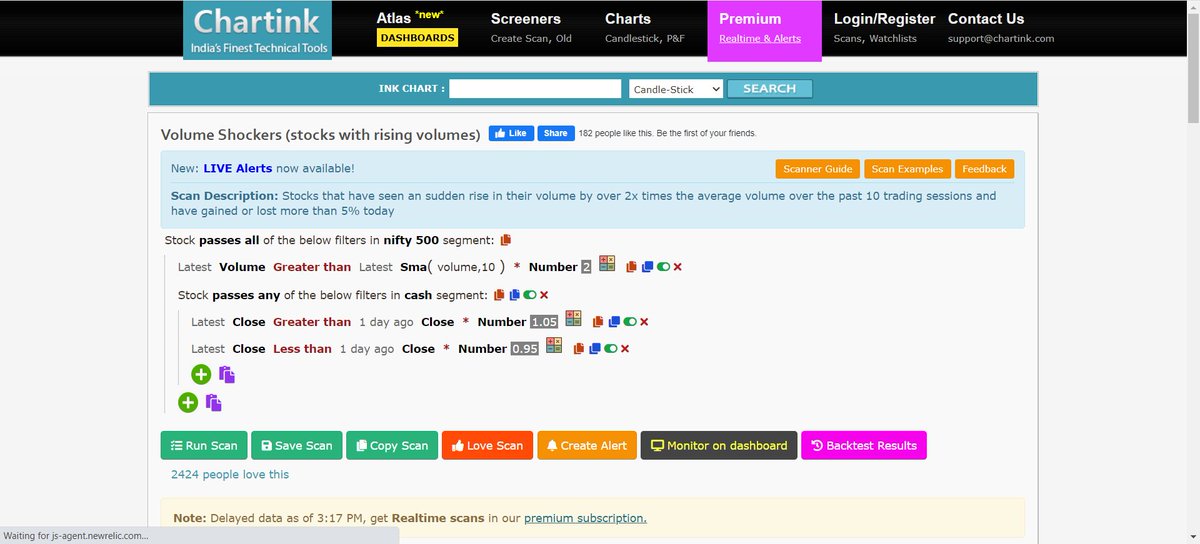
Volume Shockers - Stocks that received a huge volume
https://t.co/u9LTY5Yiir
(5/N)
Nowadays everyday market is opening with big gaps.
Solution?
Shifting to Stocks!
But How to Pick Good Stocks for Tomorrow's Trading?
Presenting 11 FREE Screeners to scan Stocks for the Next Trading Day!
Thread 🧵
(1/N)
MYFNO - To Know the Stocks Which Received High and Low Open Interest (OI)
https://t.co/FURZDTArKK
(2/N)
Shortlist Bullish Momentum Stocks
This Screener shortlists all the bullish momentum stocks from NSE for the next day's trading (based on price action).
https://t.co/3teN7JLDMs
(3/N)
Screeners Based on Price (ex: Previous Day Breakout, Weekly Breakout, Monthly Breakout, etc.)
https://t.co/Y5naQIx967
(4/N)
Volume Shockers - Stocks that received a huge volume
https://t.co/u9LTY5Yiir
(5/N)


More from Banknifty

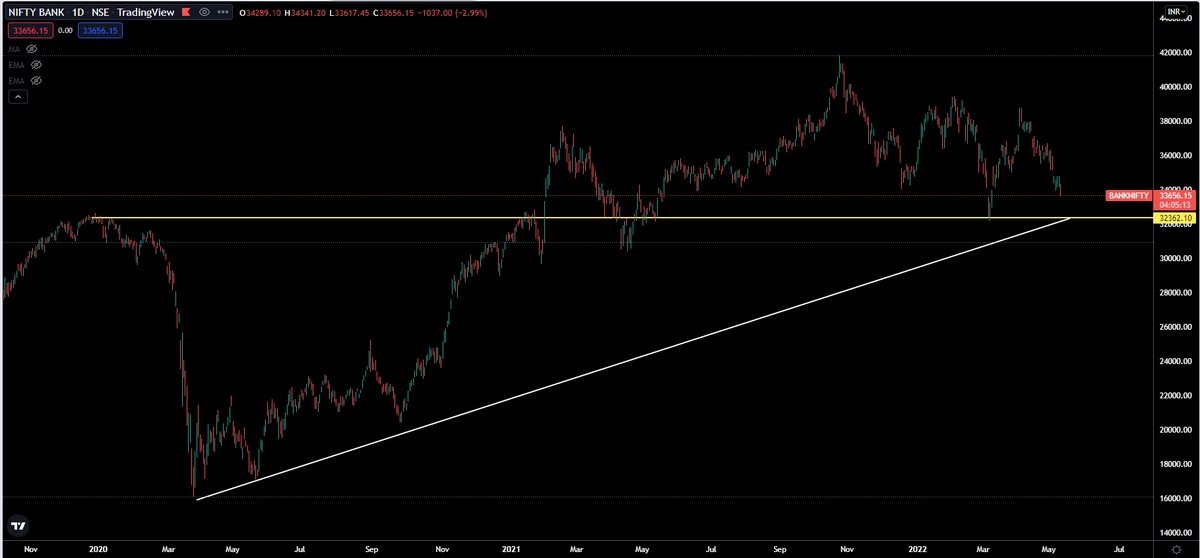
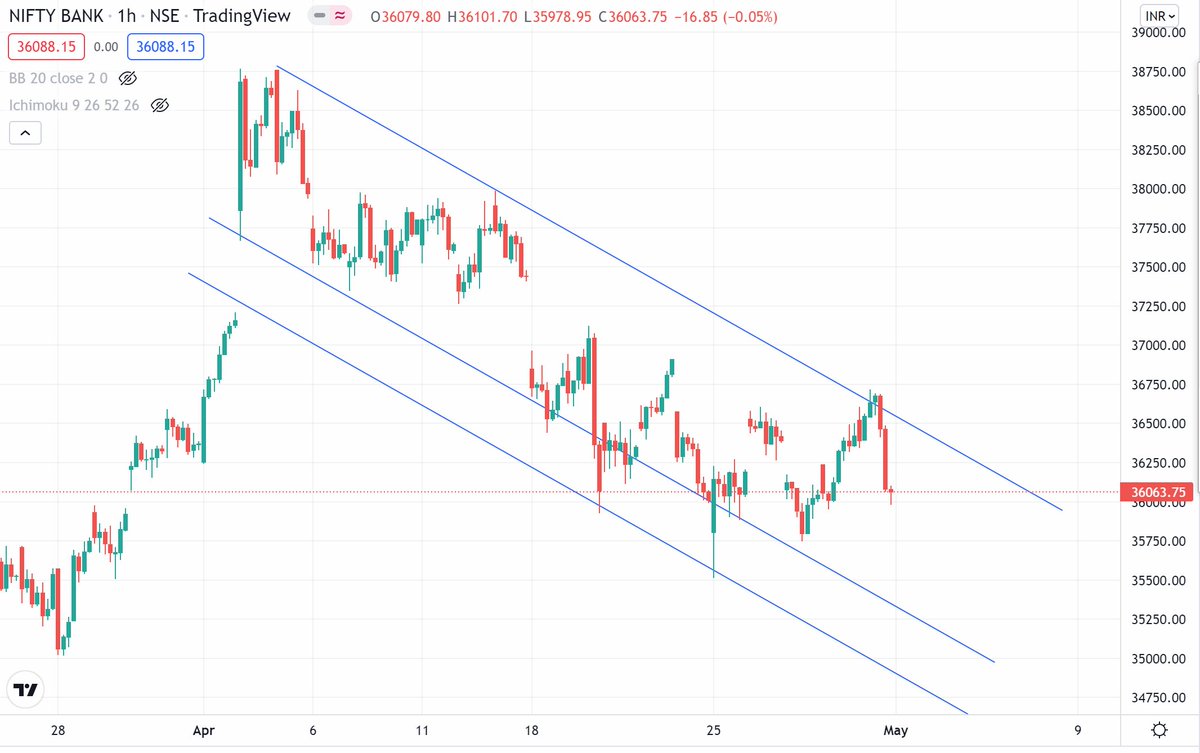
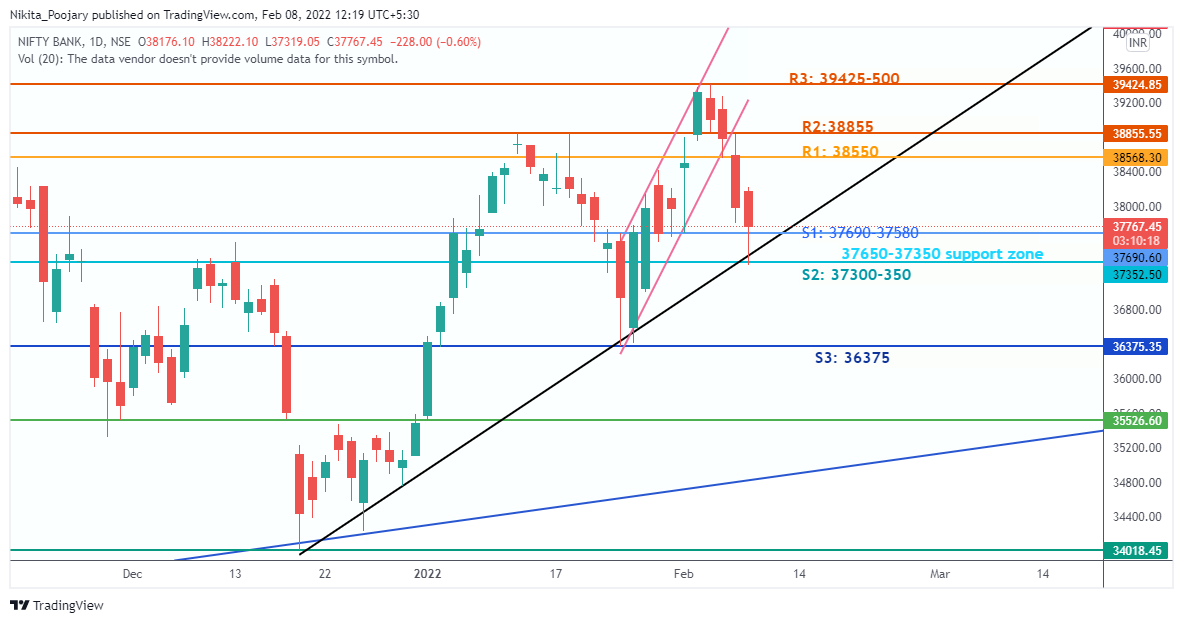
#BANKNIFTY
Look how it took support of the upward sloping black trendline https://t.co/mhqkIzBkQN
Look how it took support of the upward sloping black trendline https://t.co/mhqkIzBkQN
#BANKNIFTY
— Nikita Poojary (@niki_poojary) February 6, 2022
\U0001d403\U0001d41a\U0001d422\U0001d425\U0001d432 \U0001d413\U0001d405: 38855 is the BO level on daily TF which was taken out on Feb 2 & if BNF sustains above 39500 level in the coming week then we can see a fresh leg of upmove
Formation of rising wedge i.e. HH & HL pattern
S/R on daily mentioned pic.twitter.com/liaqfEezkW