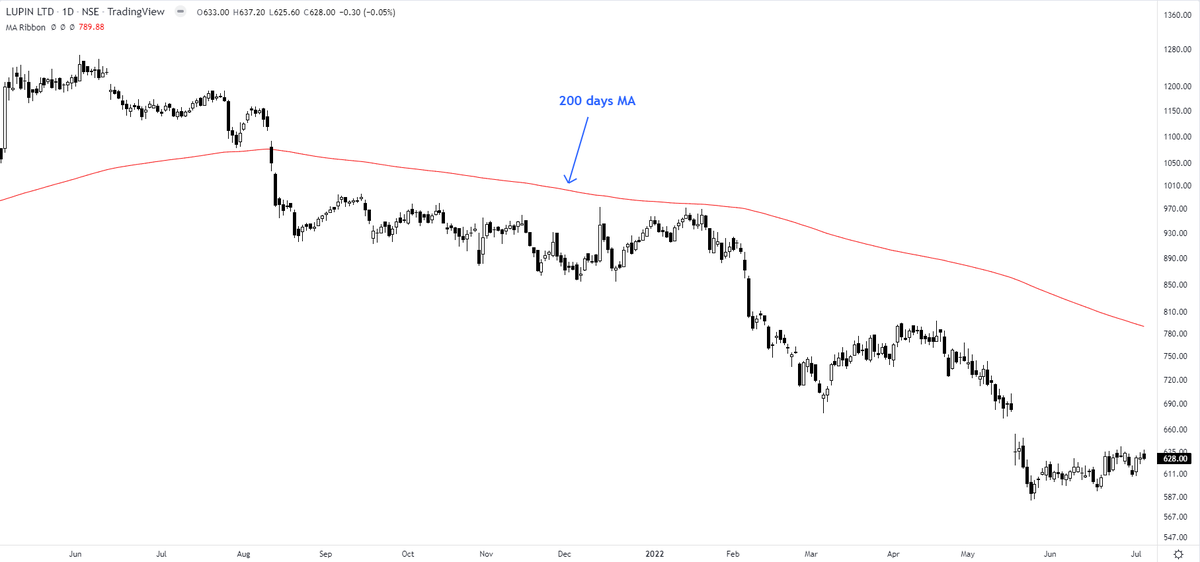
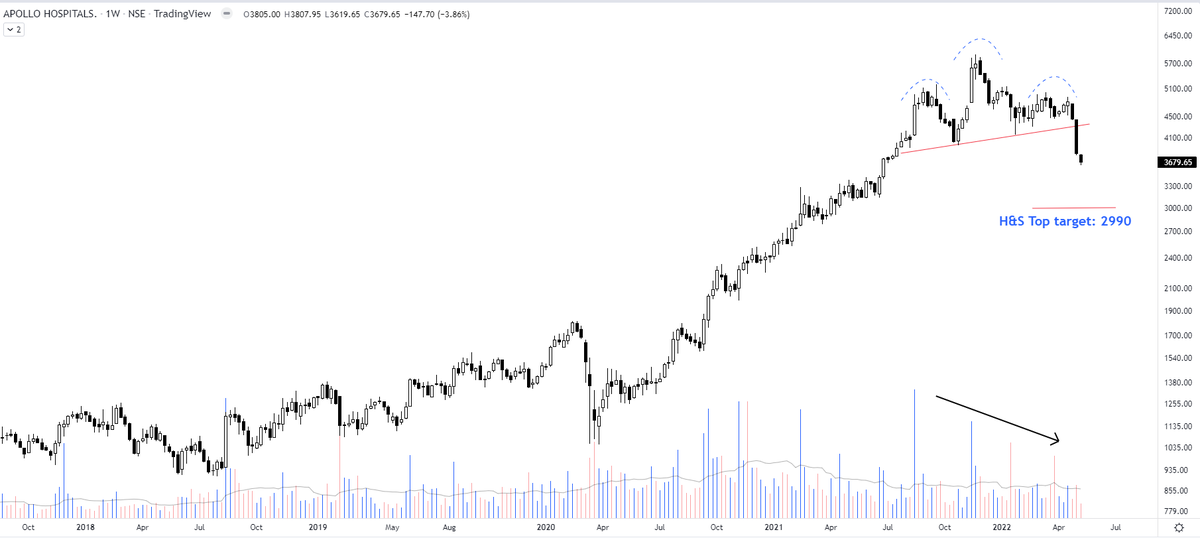
H&S tops with ascending necklines are easy to trade for the reason of their premature signals. Even if you don't know the name of the pattern, you can simply gauge that your stock is unable to form a fresh high & broke down with declining volumes
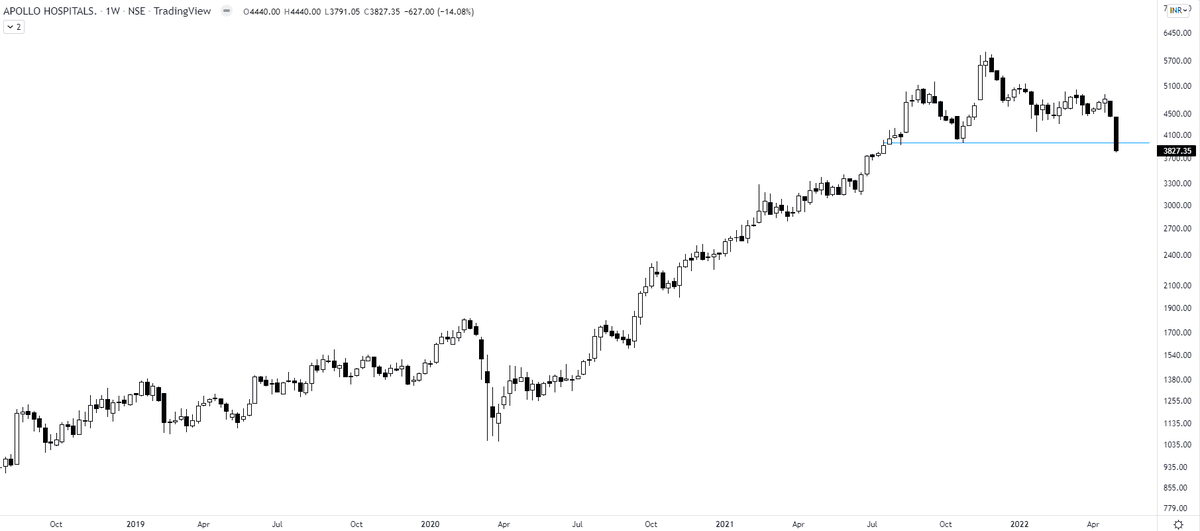
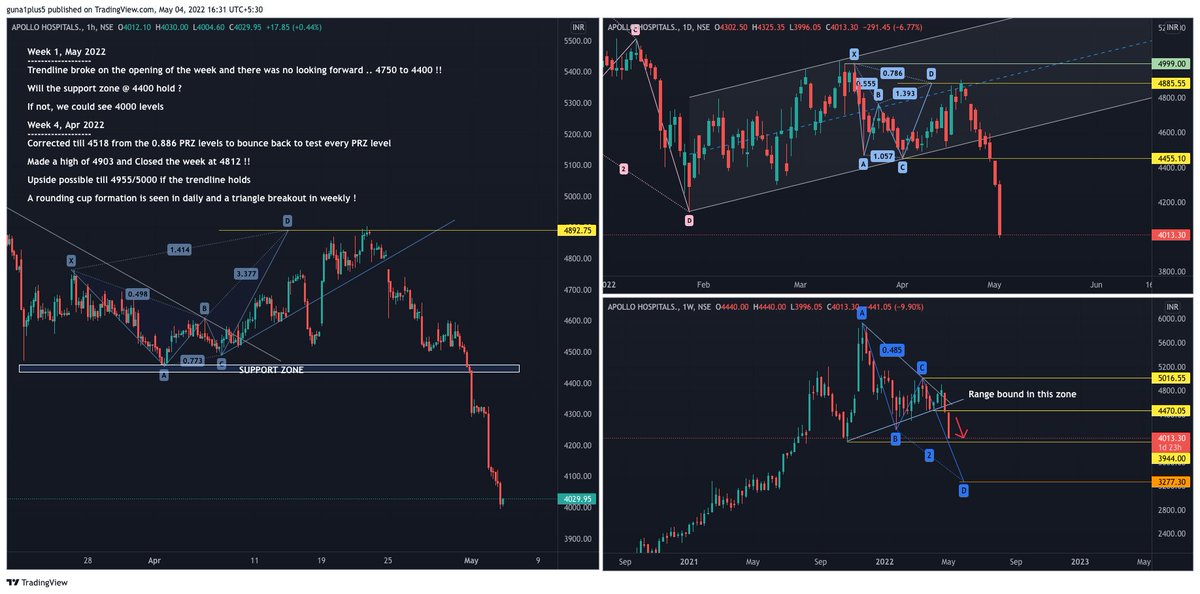
Apollo Hospitals - target 2990
More from The_Chartist 📈
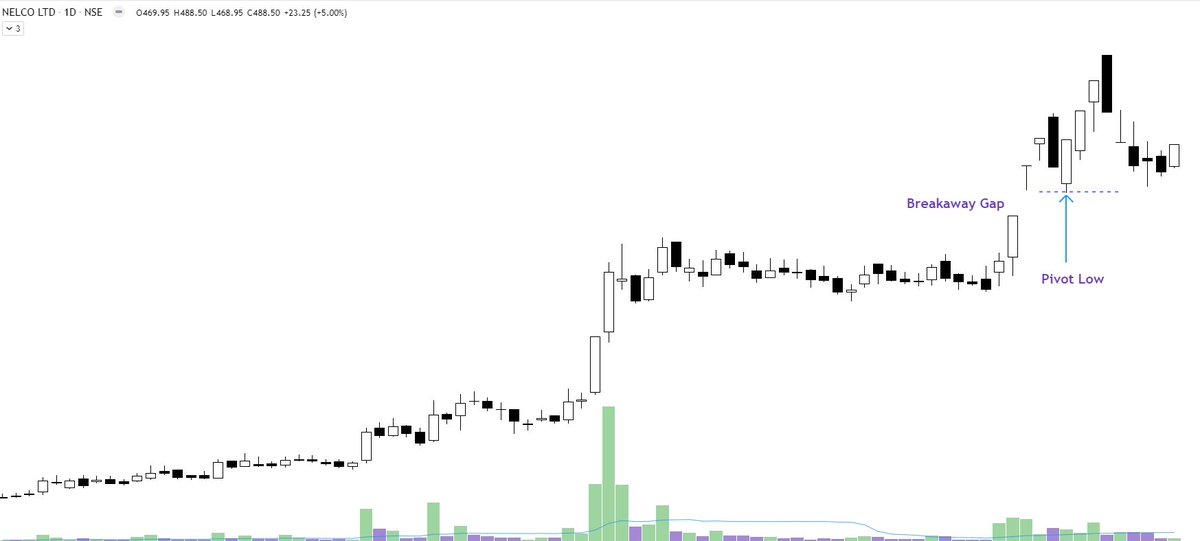
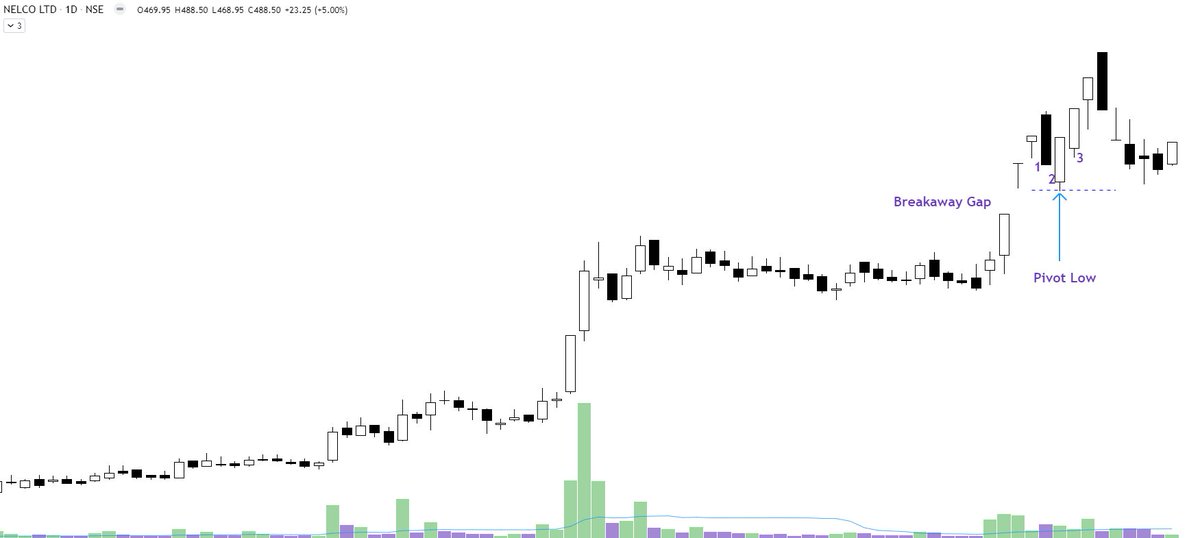

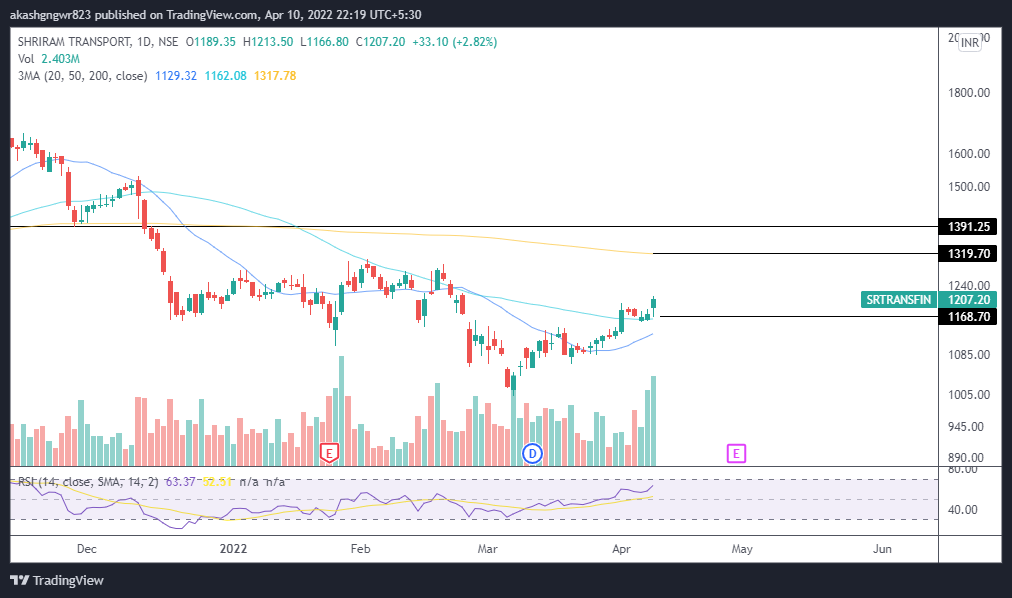
It is important to analyse the strength of the breakout. If the price does not continues the move in 1 or 2 sessions and candles show long upper wicks, it is better to bring the SL closer. Distribution sign.
Will be helpful in next breakouts. https://t.co/AtZOj4bKeT
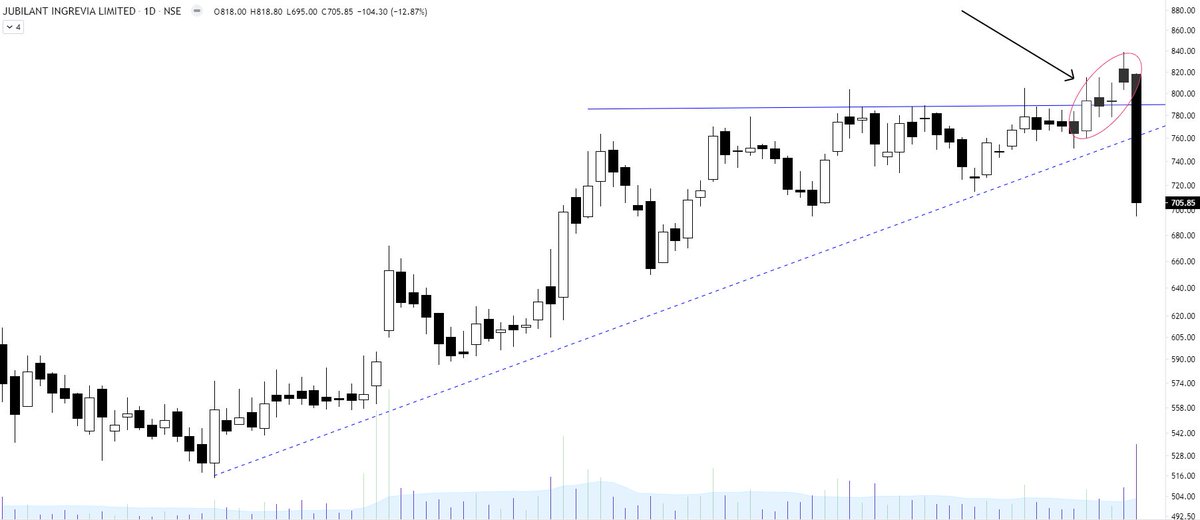
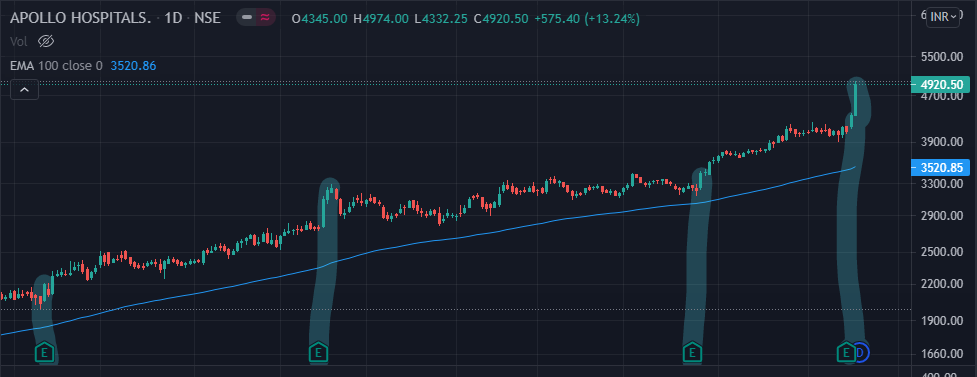
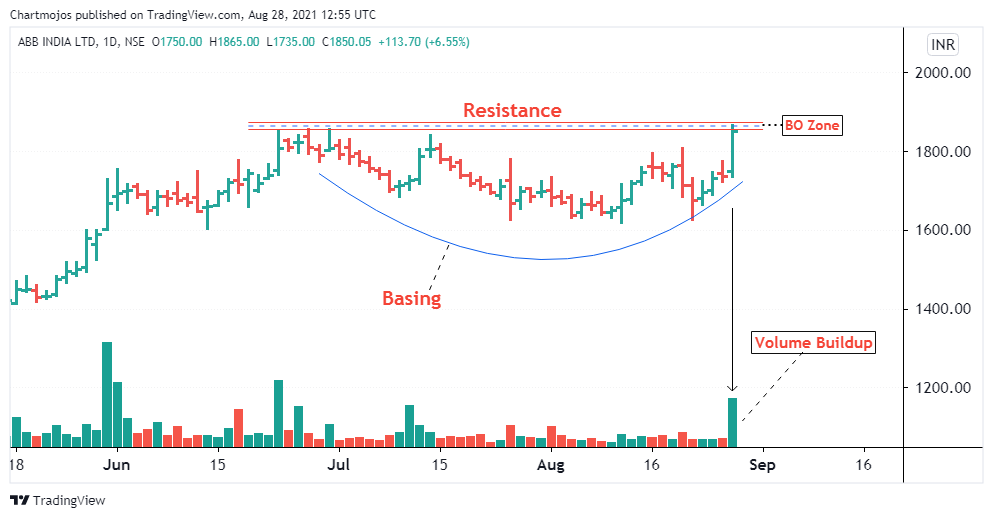
Learning: Strong breakout
— The_Chartist \U0001f4c8 (@nison_steve) July 2, 2021
1. Breakout candle will have no upper shadow or extremely less compared to the body
2. Volumes will be high (to avoid retailers to enter & also big hand absorbing all the selling)
3. Pullbacks will be rare/very less
4. Happens after a long consolidation pic.twitter.com/YTHDOnEdxo
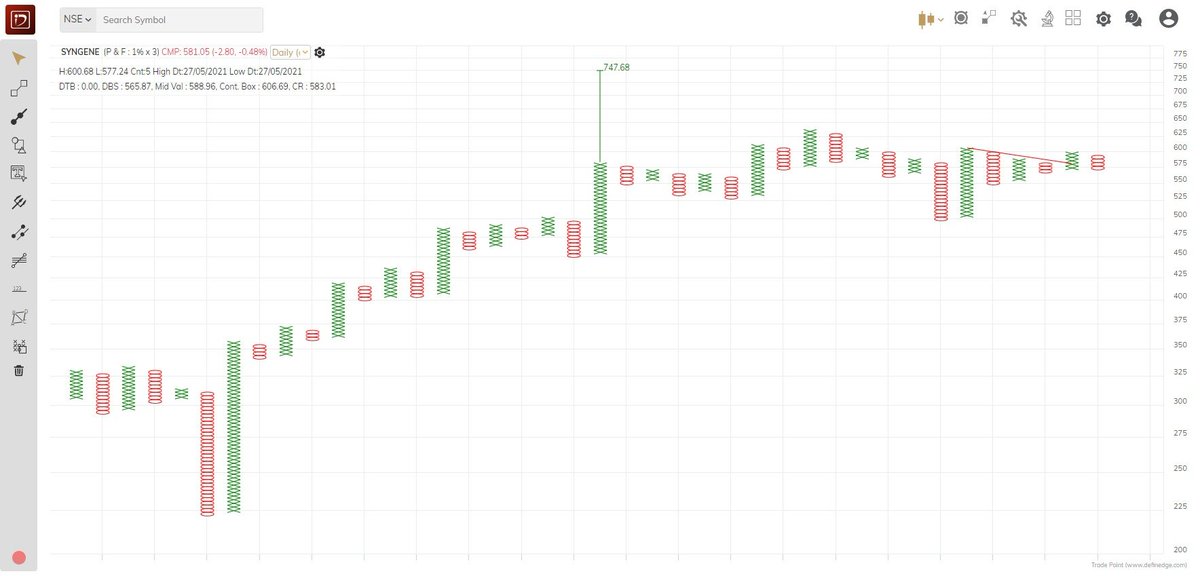
Syngene - Same concept. Price contraction. Shift from weak to strong hands through repeated volatility contractions. I can well write one whole page explanation on it. Look at the volume pump today. A big hand will never let you ride with him. Make sure you are there at the party https://t.co/RN8sQYzdBg pic.twitter.com/AShKWnQeJt
— Steve Nison (@nison_steve) July 15, 2021
Nifty Private Bank https://t.co/BwG1DKhhLc
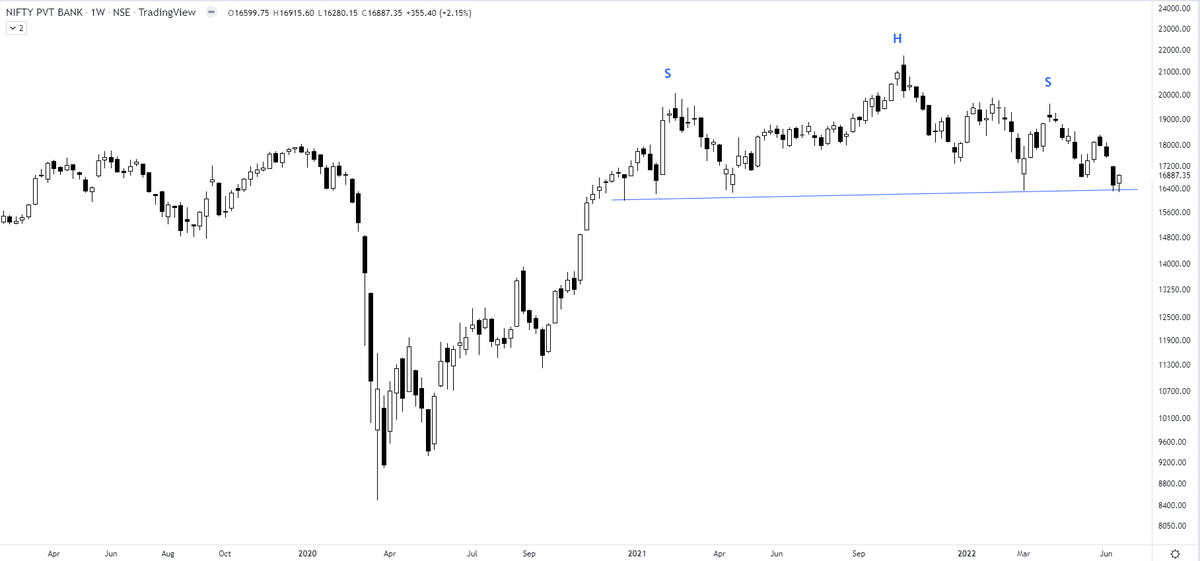
I am watching a big bearish H&S top building up in Nifty Private Bank Index. Any breakdown will result in increased volatility in respective charts. For traders - definitely not a spot to be in. The index has to move beyond 19900 to negate the pattern. pic.twitter.com/IGFeyNrtQV
— The_Chartist \U0001f4c8 (@charts_zone) June 19, 2022