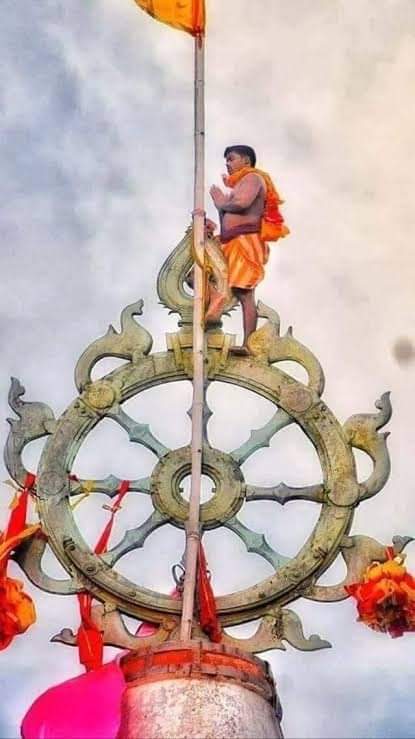
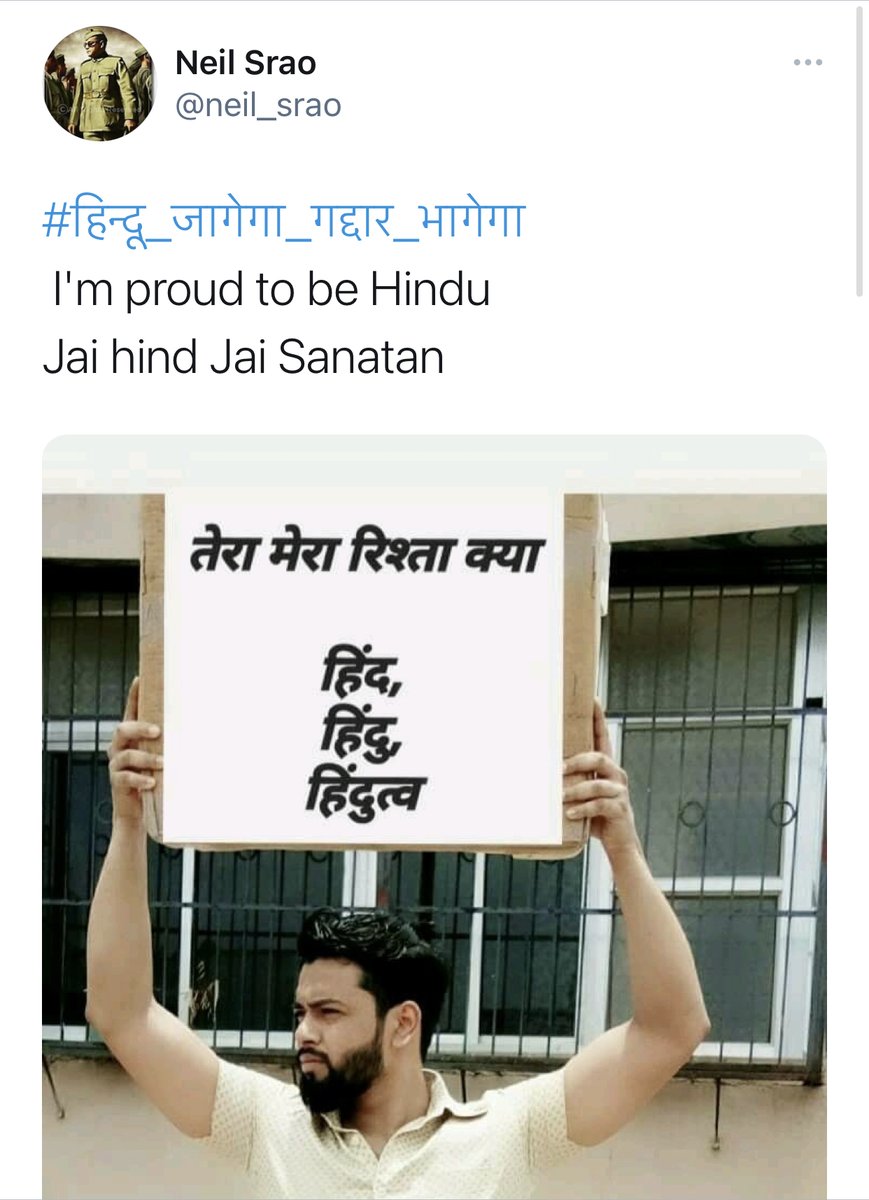
'Tera mera rishta kya, hindu, hindu,hindutva' is a clear take on 'tera mera rishta kya,la ilaha illallah'. As much as Hindutva hates the monotheistic religions especially Islam, there's a strange wistfulness and subliminal need at display now, to BE that they hate. 1
Charlie Hebdo doesn’t come up as a cautionary tale now but rather 'why cant we be like that'?
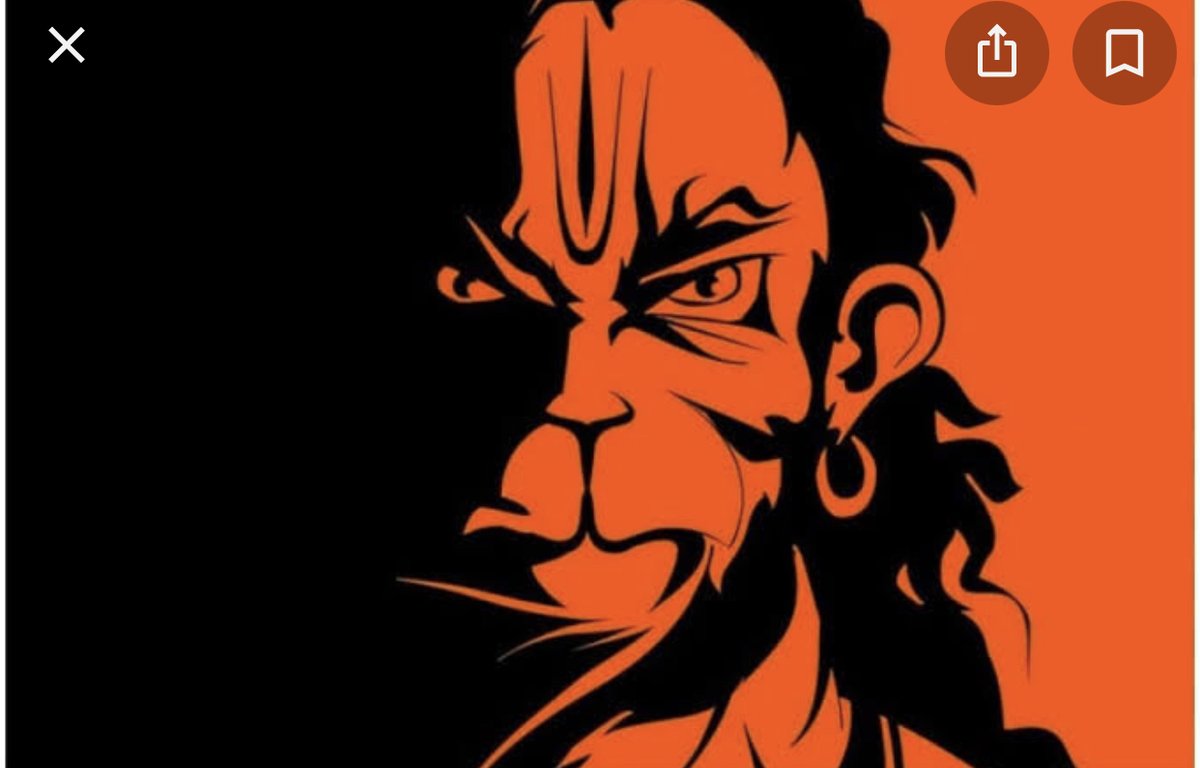
Growing up, Hanuman was an adorable deity for us, who swallowed the sun, or who couldn’t figure out what was Sanjeevani booti so he picked up a whole mountain and came back with it. 2
Or he was loyal, admirable and when he cleaved his chest, you saw both Ram and Sita. Now we have a lot of “Angry Hanuman” stickers. Why is a cute childlike God angry? We don’t know. It's a convenient blank space where to paint all the angst of Hindu Khatre mein hain narrative. 3
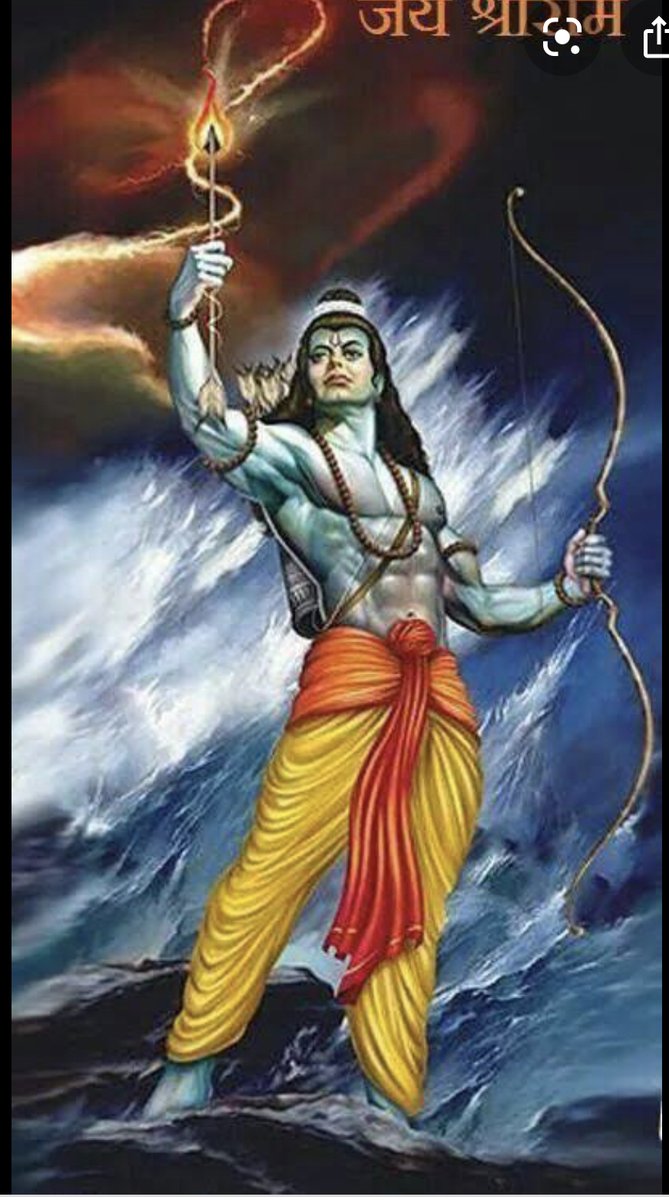
The other strange thing that has started happening is pictures of Ram appearing sans Sita. “Jai Siya Ram” has become “Jai Shri Ram”. Some people disingenuously explain it as being the same thing - because Shri is a name of Lakshmi. Not really. Siya is an apbhransh of Sita. 4
Shri is a prefix of respect in this case. Hinduism is being militarised. A woman/Sita has no place in it. Even the militaristic Goddess that is Durga has no place in this conception of neo-Hindu divinity, as evidenced by Dilip Mandal wondering where Durga came from. 5