Authors JayneshKasliwal
7 days
30 days
All time
Recent
Popular


𝟱 𝗧𝗿𝗮𝗱𝗶𝗻𝗴𝘃𝗶𝗲𝘄 𝗜𝗻𝗱𝗶𝗰𝗮𝘁𝗼𝗿𝘀 𝗮𝗹𝗹 𝗧𝗿𝗮𝗱𝗲𝗿𝘀 𝘀𝗵𝗼𝘂𝗹𝗱 𝗸𝗻𝗼𝘄 𝗮𝗯𝗼𝘂𝘁:
𝗣𝗮𝗿𝘁 𝟮
🧵 Thread 🧵
Retweet And I will Link a 36 Page PDF
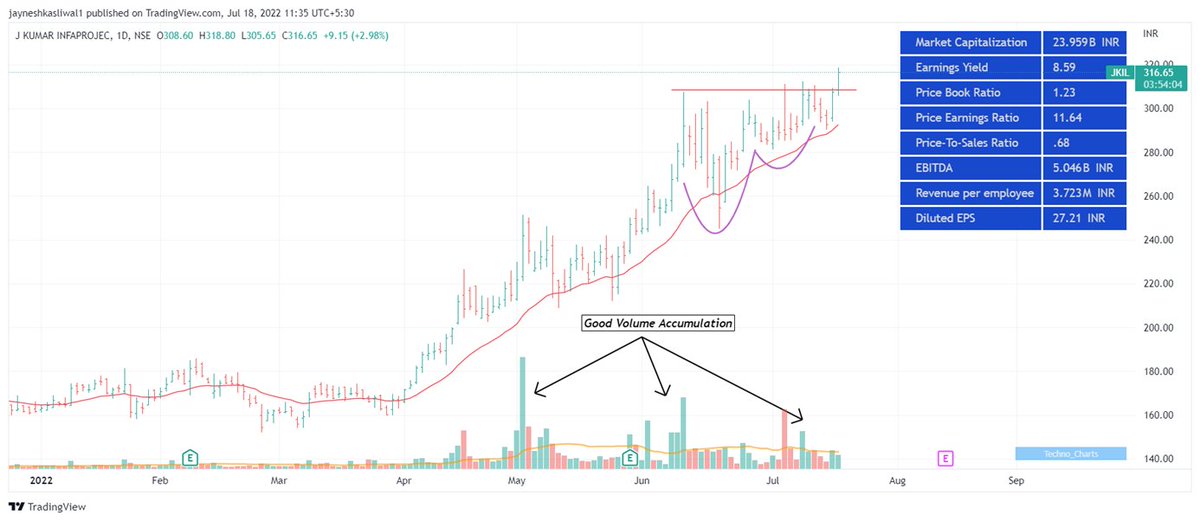
𝟭. 𝗔𝗱𝗱 𝗙𝘂𝗻𝗱𝗮𝗺𝗲𝗻𝘁𝗮𝗹𝘀 𝗼𝗻 𝗰𝗵𝗮𝗿𝘁
🔸 Link:
https://t.co/HcIXT7V002
🔸 Click on the above link -> Add to Favourites -> Add on Chart from favourites and start using it !
2/20
You can add financials from many fundamental criteria's like
🔸 Cashflows
🔸 Income Statements
🔸 Balance sheets
🔸 PE,PB ratios
🔸 Marketcapitlization
🔸 Statistics
3/20
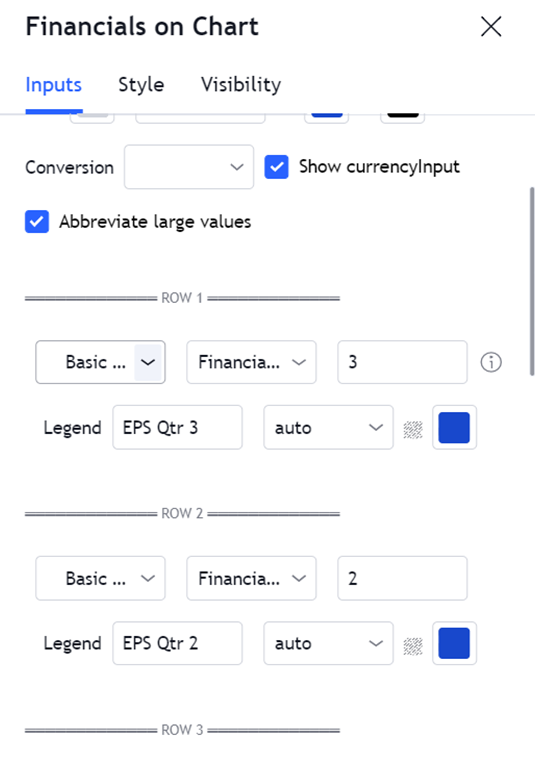
How to change Settings:
🔸 There are 8 columns you can basically select any financial you want
🔸 You can select quarterly or Yearly values and can also write
🔸 The names of the financiaLS Example : EPS Qtr3
🔸 You can Change colours , font size
4/20
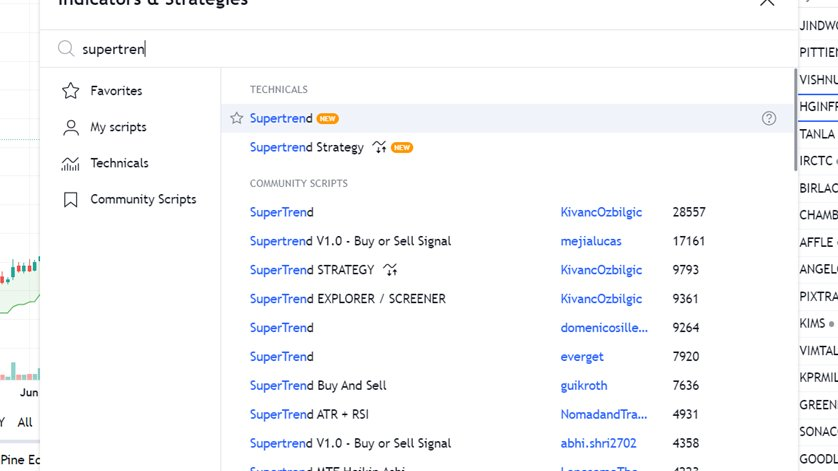
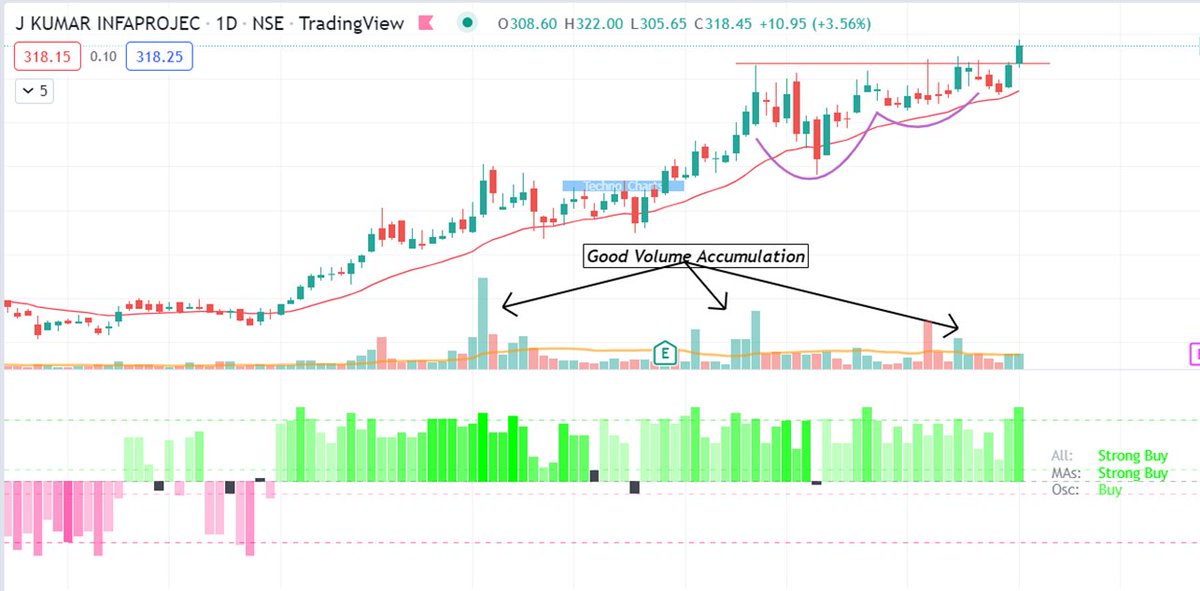
𝟮. 𝗜𝗻𝗱𝗶𝗰𝗮𝘁𝗼𝗿 𝗥𝗮𝘁𝗶𝗻𝗴𝘀
You cannot track each and every indicator like ( 𝗠𝗼𝘃𝗶𝗻𝗴 𝗔𝘃𝗴𝘀 , 𝗥𝗦𝗜 , 𝗠𝗔𝗖𝗗 ) etc , you can use plot this custom strategy to understand whether the trend is positive or negative of those indicators
5/20
𝗣𝗮𝗿𝘁 𝟮
🧵 Thread 🧵
Retweet And I will Link a 36 Page PDF
𝟭. 𝗔𝗱𝗱 𝗙𝘂𝗻𝗱𝗮𝗺𝗲𝗻𝘁𝗮𝗹𝘀 𝗼𝗻 𝗰𝗵𝗮𝗿𝘁
🔸 Link:
https://t.co/HcIXT7V002
🔸 Click on the above link -> Add to Favourites -> Add on Chart from favourites and start using it !
2/20
You can add financials from many fundamental criteria's like
🔸 Cashflows
🔸 Income Statements
🔸 Balance sheets
🔸 PE,PB ratios
🔸 Marketcapitlization
🔸 Statistics
3/20
How to change Settings:
🔸 There are 8 columns you can basically select any financial you want
🔸 You can select quarterly or Yearly values and can also write
🔸 The names of the financiaLS Example : EPS Qtr3
🔸 You can Change colours , font size
4/20
𝟮. 𝗜𝗻𝗱𝗶𝗰𝗮𝘁𝗼𝗿 𝗥𝗮𝘁𝗶𝗻𝗴𝘀
You cannot track each and every indicator like ( 𝗠𝗼𝘃𝗶𝗻𝗴 𝗔𝘃𝗴𝘀 , 𝗥𝗦𝗜 , 𝗠𝗔𝗖𝗗 ) etc , you can use plot this custom strategy to understand whether the trend is positive or negative of those indicators
5/20