Books all Traders Should Definitely Read
1 . Secret of Profiting in Bull And Bear Market : Stan Weinstein
2. How to make Money in Stocks : William o Neil
3. Trade Like a Stock Market Wizard :
4. Think and Trade like a champion:
markminervini
Mention Your Favourites 👇
More from JayneshKasliwal

Criteria
Screener to Find Swing Stocks.
1. 15% Range of Near 52 week high
2. Avg Volume > 1 lakh
3. Market Cap > 2000 Cr
4. Roe Roce > 20%
5. Eps Increasing Qtr on Qtr
6. Above 50 ema
1/
How to use This Screener
1. Basically we are screening Fundamentally strong stock
2. These are Technically Strong also as stocks are near 52 week high and above 50 ema
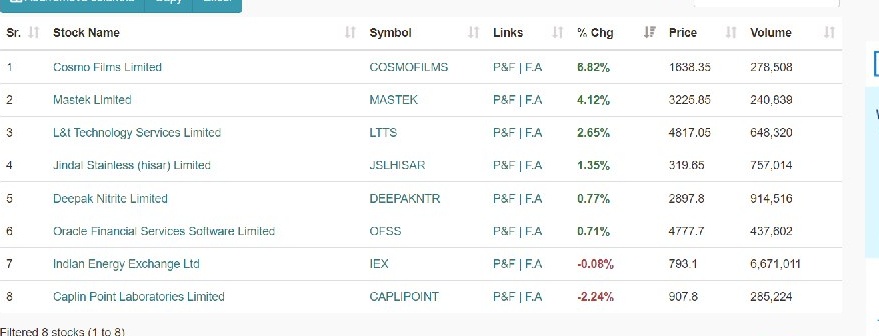
3. Below is the list For the screened Stocks.
4. Target should be on RR
@StocksNerd @MarketScientist
2/
When to Enter
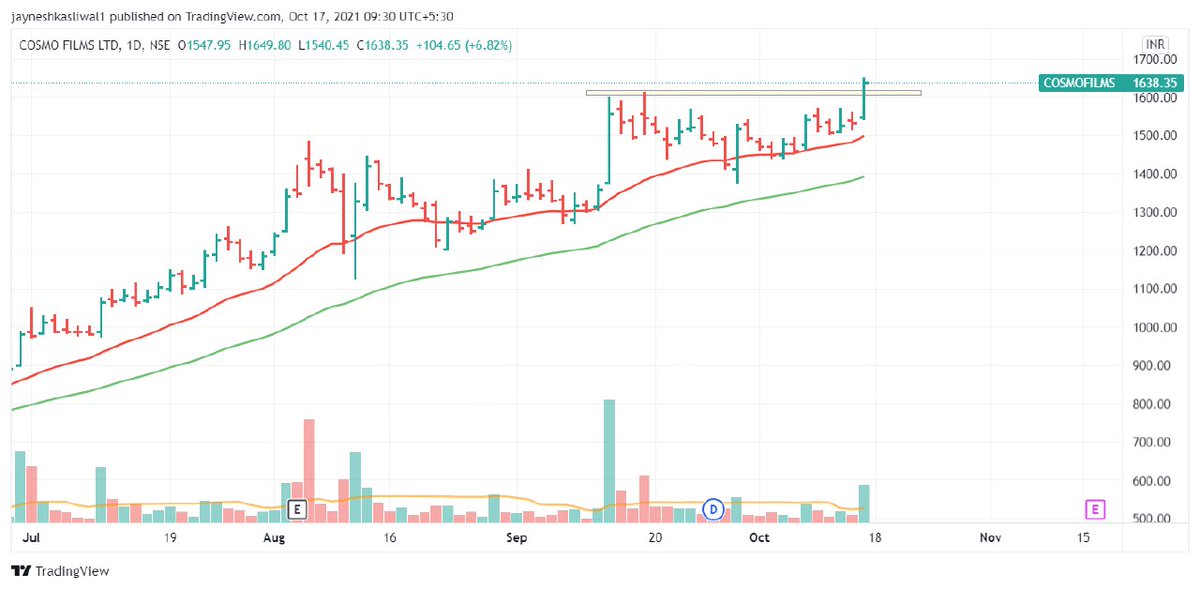
1. When 52 week High is Broken
2. Filter Stocks Select Stock With High Relative Strength
Example : #CosmoFilms , #Mastek
3. Keep Sl Below 21 ema
4. Keep Trailing Using 21 ema
5. Enter stocks on high volume breakout
6.Look for Price Range Contraction
3.
Your Most work is done by the screener
The most important task is filtering out manually and that's where your Returns will differ
As we are screening TechnoFunda stocks these can used for momentum investing
Join telegram https://t.co/b4N4oPAto9
@AmitabhJha3 @chartians


Complete Backtest and Indicator link
🧵 A Thread 🧵
𝗦𝗲𝘁𝘂𝗽:
🔸 Monthly Option Buying
🔸 50 ema on 3 min timeframe
🔸 Supertrend 10 , 3
🔸 Chart : Banknifty , Nifty Futures as we backtested on futures
🔸 Entry 9:20 to 3:00
🔸 Max 3 Entries per day
🔸 Premium nearest to 200 Rs only
[2/18]
Why Monthly Option buying ?
🔸 Less theta decay compared to weekly options
🔸 Less Volatility
🔸 Supertrend and MA Settings
[3/18]

🔸 Indicator Link
🔸 Click on the below 𝘭𝘪𝘯𝘬 -> 𝘈𝘥𝘥 𝘵𝘰 𝘍𝘢𝘷𝘰𝘶𝘳𝘪𝘵𝘦𝘴 -> 𝘈𝘥𝘥 𝘰𝘯 𝘊𝘩𝘢𝘳𝘵 from favourites and start using it !
🔸 https://t.co/zVXavqLBto
[4/18]
𝗜𝗻𝗱𝗶𝗰𝗮𝘁𝗼𝗿 𝗦𝗲𝘁𝘁𝗶𝗻𝗴𝘀 :
🔸 Max 6 Trades per day ( Both CE and PE buy)
🔸 Timings 9:20 am to 3:00 pm
🔸 Supertrend : 10,3
🔸 Moving Average 50 ema
[5/18]

🧵 Thread 🧵
[1/15]
𝗖𝗵𝗮𝗿𝘁𝗶𝗻𝗸 𝗦𝗰𝗿𝗲𝗲𝗻𝗲𝗿 is a Stock screening tool that is useful to screen stocks based on Technical & Fundamentals.
🔸 It scans stocks by using technical indicators like RSI, MACD, divergences, etc.
🔸 It also uses fundamental tools like Book Value, EPS,PE etc
[2/15]
How To Create A Scan ?
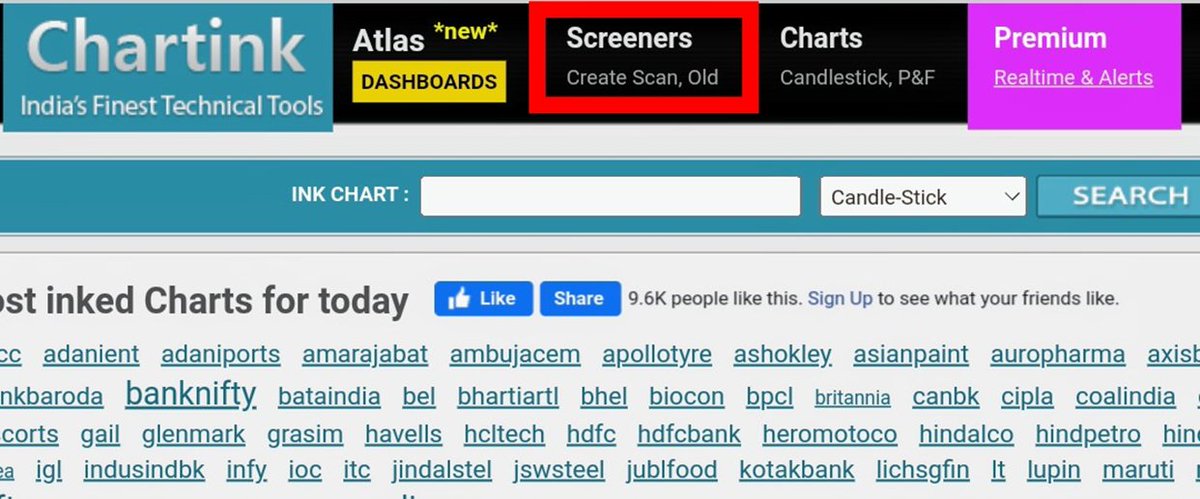
Go to https://t.co/JJEJBg3Cd8 & click on 𝘊𝘳𝘦𝘢𝘵𝘦 𝘚𝘤𝘢𝘯 under 𝘚𝘤𝘳𝘦𝘦𝘯𝘦𝘳𝘴.
[3/15]
𝗙𝗶𝗿𝘀𝘁 𝗦𝘁𝗲𝗽 𝗧𝗼 𝗙𝗶𝗹𝘁𝗲𝗿 𝗦𝘁𝗼𝗰𝗸𝘀
We can select segments of stocks of our choice, e.g. cash or futures stocks, Nifty 100 etc.
Click on green ‘+’ icon to add conditions.
[4/15]

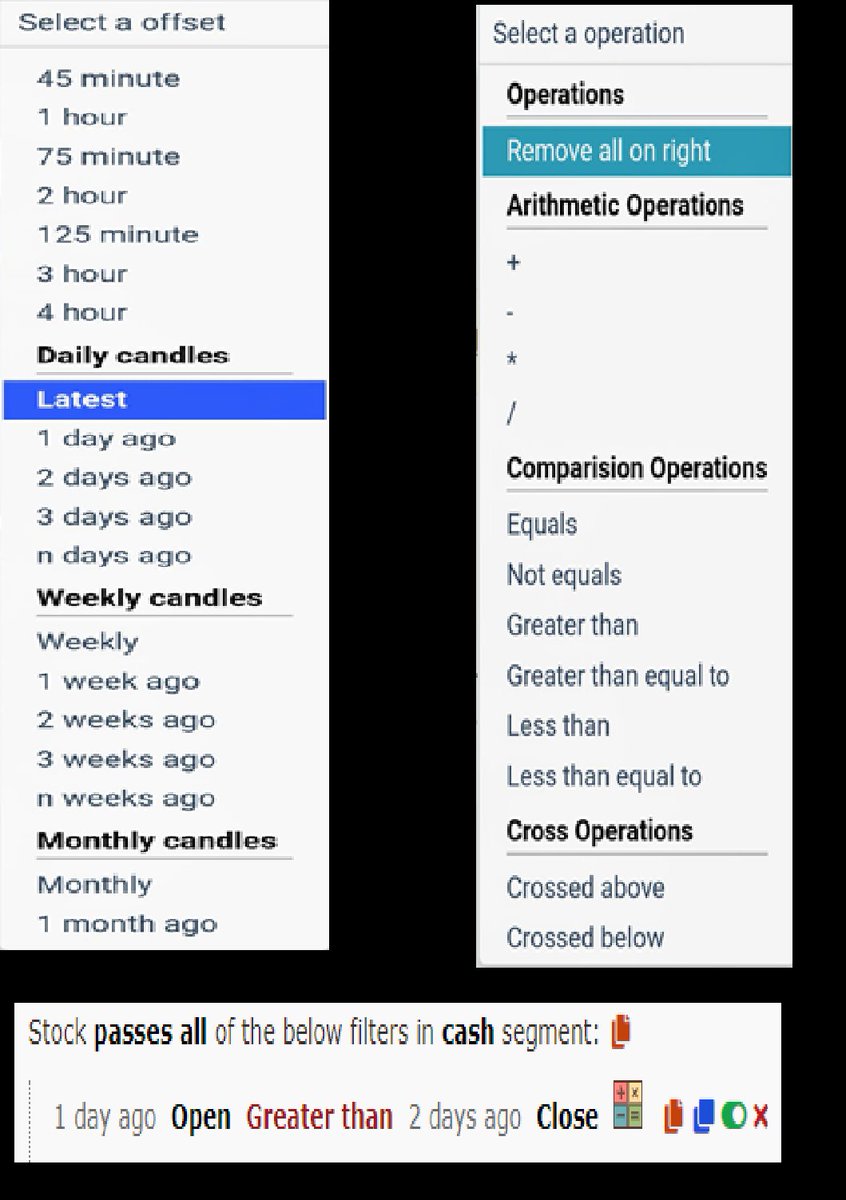
𝗖𝗮𝗻𝗱𝗹𝗲 𝗧𝗶𝗺𝗲𝗳𝗿𝗮𝗺𝗲𝘀 & 𝗖𝗼𝗺𝗽𝗮𝗿𝗶𝘀𝗼𝗻 𝗢𝗽𝗲𝗿𝗮𝘁𝗼𝗿𝘀🔸 We can select any timeframe of candles in Chartink, from minutes to years.
🔸 And compare two candles using comparison operators like 𝘌𝘲𝘶𝘢𝘭 𝘵𝘰 or 𝘎𝘳𝘦𝘢𝘵𝘦𝘳 𝘛𝘩𝘢𝘯 , crossovers etc
[5/15]
You May Also Like




Like company moats, your personal moat should be a competitive advantage that is not only durable—it should also compound over time.
Characteristics of a personal moat below:
I'm increasingly interested in the idea of "personal moats" in the context of careers.
— Erik Torenberg (@eriktorenberg) November 22, 2018
Moats should be:
- Hard to learn and hard to do (but perhaps easier for you)
- Skills that are rare and valuable
- Legible
- Compounding over time
- Unique to your own talents & interests https://t.co/bB3k1YcH5b
2/ Like a company moat, you want to build career capital while you sleep.
As Andrew Chen noted:
People talk about \u201cpassive income\u201d a lot but not about \u201cpassive social capital\u201d or \u201cpassive networking\u201d or \u201cpassive knowledge gaining\u201d but that\u2019s what you can architect if you have a thing and it grows over time without intensive constant effort to sustain it
— Andrew Chen (@andrewchen) November 22, 2018
3/ You don’t want to build a competitive advantage that is fleeting or that will get commoditized
Things that might get commoditized over time (some longer than
Things that look like moats but likely aren\u2019t or may fade:
— Erik Torenberg (@eriktorenberg) November 22, 2018
- Proprietary networks
- Being something other than one of the best at any tournament style-game
- Many "awards"
- Twitter followers or general reach without "respect"
- Anything that depends on information asymmetry https://t.co/abjxesVIh9
4/ Before the arrival of recorded music, what used to be scarce was the actual music itself — required an in-person artist.
After recorded music, the music itself became abundant and what became scarce was curation, distribution, and self space.
5/ Similarly, in careers, what used to be (more) scarce were things like ideas, money, and exclusive relationships.
In the internet economy, what has become scarce are things like specific knowledge, rare & valuable skills, and great reputations.