
Key steps to be successful:
Step1: Stock Selection.
Step2: Find the Trend.
Step3: Find Entry, Target & SL (Plan).
Step4: Allocate Capital as per % RISK.
Step5: Focus on Planning with Discipline along with PATIENCE.
Step6: Make a Trading Journal.
Step7: Repeat.
#Learning
More from JayneshKasliwal


Im sharing A stock Screener+Swing Strategy
Criteria
Screener to Find Swing Stocks.
1. 15% Range of Near 52 week high
2. Avg Volume > 1 lakh
3. Market Cap > 2000 Cr
4. Roe Roce > 20%
5. Eps Increasing Qtr on Qtr
6. Above 50 ema
1/
How to use This Screener
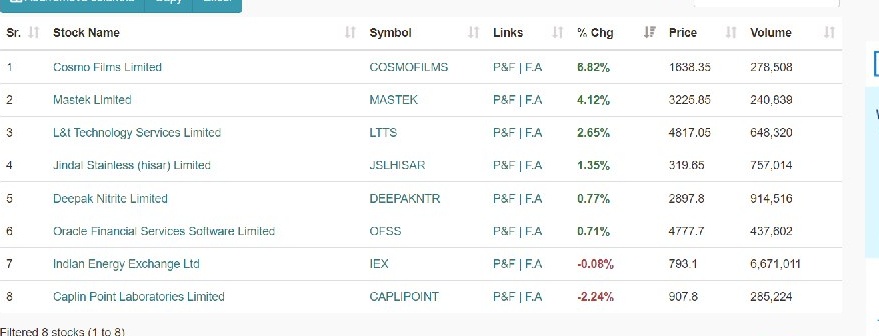
1. Basically we are screening Fundamentally strong stock
2. These are Technically Strong also as stocks are near 52 week high and above 50 ema
3. Below is the list For the screened Stocks.
4. Target should be on RR
@StocksNerd @MarketScientist
2/
When to Enter
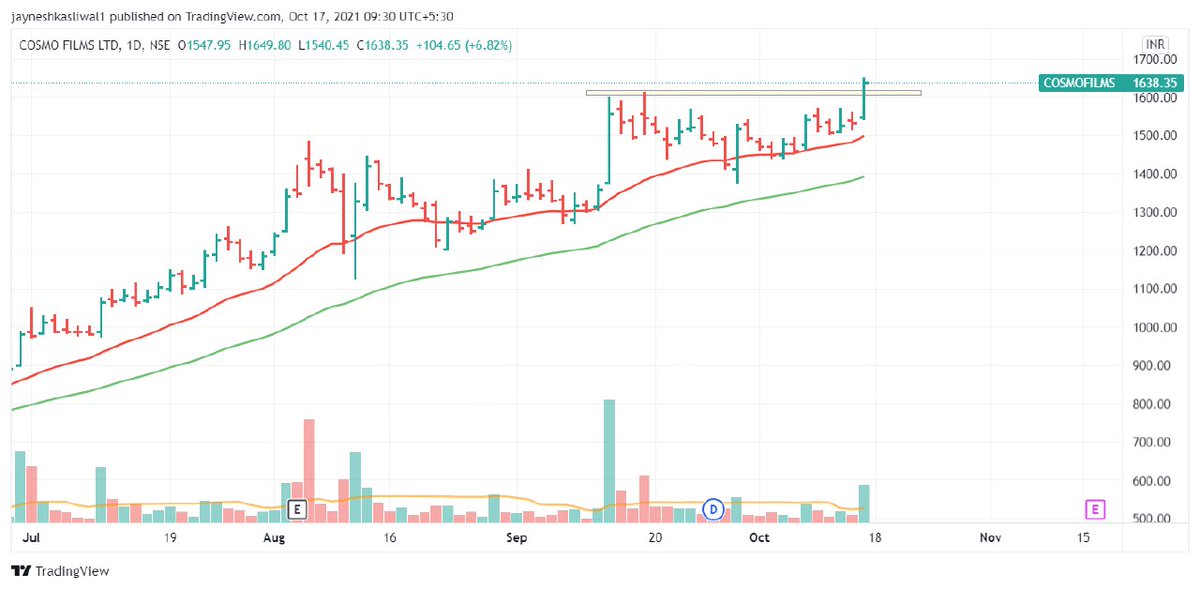
1. When 52 week High is Broken
2. Filter Stocks Select Stock With High Relative Strength
Example : #CosmoFilms , #Mastek
3. Keep Sl Below 21 ema
4. Keep Trailing Using 21 ema
5. Enter stocks on high volume breakout
6.Look for Price Range Contraction
3.
Your Most work is done by the screener
The most important task is filtering out manually and that's where your Returns will differ
As we are screening TechnoFunda stocks these can used for momentum investing
Join telegram https://t.co/b4N4oPAto9
@AmitabhJha3 @chartians
Criteria
Screener to Find Swing Stocks.
1. 15% Range of Near 52 week high
2. Avg Volume > 1 lakh
3. Market Cap > 2000 Cr
4. Roe Roce > 20%
5. Eps Increasing Qtr on Qtr
6. Above 50 ema
1/
How to use This Screener
1. Basically we are screening Fundamentally strong stock
2. These are Technically Strong also as stocks are near 52 week high and above 50 ema
3. Below is the list For the screened Stocks.
4. Target should be on RR
@StocksNerd @MarketScientist
2/
When to Enter
1. When 52 week High is Broken
2. Filter Stocks Select Stock With High Relative Strength
Example : #CosmoFilms , #Mastek
3. Keep Sl Below 21 ema
4. Keep Trailing Using 21 ema
5. Enter stocks on high volume breakout
6.Look for Price Range Contraction
3.
Your Most work is done by the screener
The most important task is filtering out manually and that's where your Returns will differ
As we are screening TechnoFunda stocks these can used for momentum investing
Join telegram https://t.co/b4N4oPAto9
@AmitabhJha3 @chartians


You May Also Like


Following @BAUDEGS I have experienced hateful and propagandist tweets time after time. I have been shocked that an academic community would be so reckless with their publications. So I did some research.
The question is:
Is this an official account for Bahcesehir Uni (Bau)?

Bahcesehir Uni, BAU has an official website https://t.co/ztzX6uj34V which links to their social media, leading to their Twitter account @Bahcesehir
BAU’s official Twitter account

BAU has many departments, which all have separate accounts. Nowhere among them did I find @BAUDEGS
@BAUOrganization @ApplyBAU @adayBAU @BAUAlumniCenter @bahcesehirfbe @baufens @CyprusBau @bauiisbf @bauglobal @bahcesehirebe @BAUintBatumi @BAUiletisim @BAUSaglik @bauebf @TIPBAU
Nowhere among them was @BAUDEGS to find

The question is:
Is this an official account for Bahcesehir Uni (Bau)?
Bahcesehir Uni, BAU has an official website https://t.co/ztzX6uj34V which links to their social media, leading to their Twitter account @Bahcesehir
BAU’s official Twitter account
BAU has many departments, which all have separate accounts. Nowhere among them did I find @BAUDEGS
@BAUOrganization @ApplyBAU @adayBAU @BAUAlumniCenter @bahcesehirfbe @baufens @CyprusBau @bauiisbf @bauglobal @bahcesehirebe @BAUintBatumi @BAUiletisim @BAUSaglik @bauebf @TIPBAU
Nowhere among them was @BAUDEGS to find



Stan Lee’s fictional superheroes lived in the real New York. Here’s where they lived, and why. https://t.co/oV1IGGN8R6

Stan Lee, who died Monday at 95, was born in Manhattan and graduated from DeWitt Clinton High School in the Bronx. His pulp-fiction heroes have come to define much of popular culture in the early 21st century.
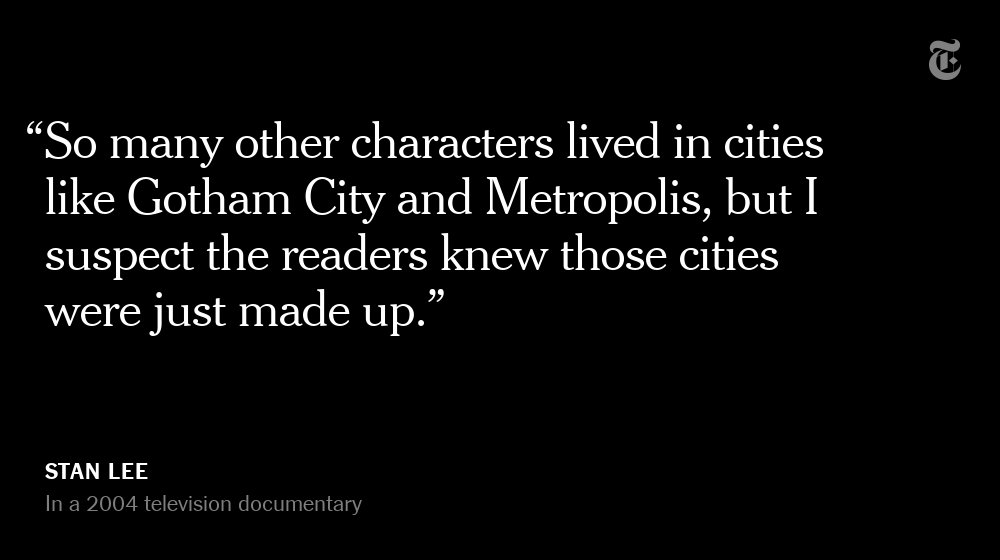
Tying Marvel’s stable of pulp-fiction heroes to a real place — New York — served a counterbalance to the sometimes gravity-challenged action and the improbability of the stories. That was just what Stan Lee wanted. https://t.co/rDosqzpP8i
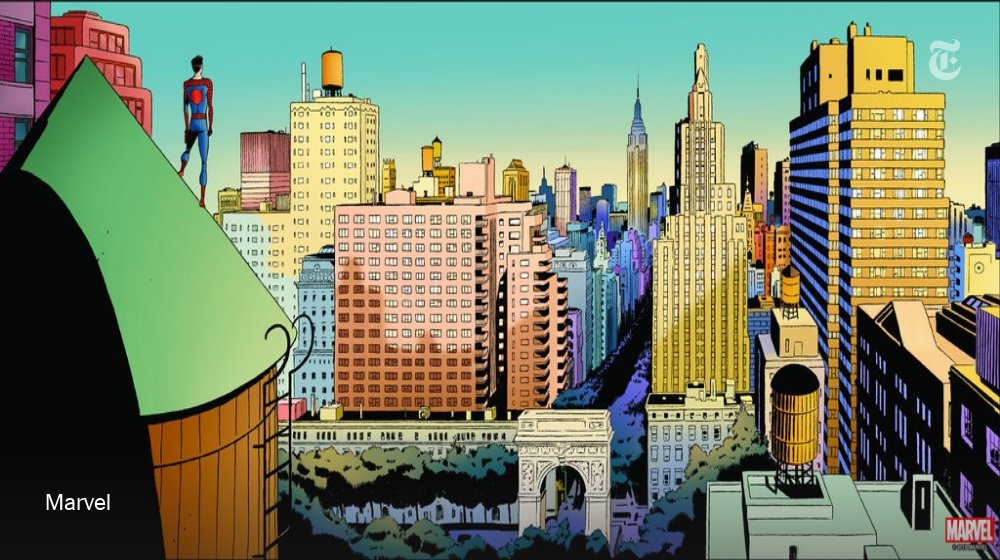
The New York universe hooked readers. And the artists drew what they were familiar with, which made the Marvel universe authentic-looking, down to the water towers atop many of the buildings. https://t.co/rDosqzpP8i
The Avengers Mansion was a Beaux-Arts palace. Fans know it as 890 Fifth Avenue. The Frick Collection, which now occupies the place, uses the address of the front door: 1 East 70th Street.
Stan Lee, who died Monday at 95, was born in Manhattan and graduated from DeWitt Clinton High School in the Bronx. His pulp-fiction heroes have come to define much of popular culture in the early 21st century.
Tying Marvel’s stable of pulp-fiction heroes to a real place — New York — served a counterbalance to the sometimes gravity-challenged action and the improbability of the stories. That was just what Stan Lee wanted. https://t.co/rDosqzpP8i
The New York universe hooked readers. And the artists drew what they were familiar with, which made the Marvel universe authentic-looking, down to the water towers atop many of the buildings. https://t.co/rDosqzpP8i
The Avengers Mansion was a Beaux-Arts palace. Fans know it as 890 Fifth Avenue. The Frick Collection, which now occupies the place, uses the address of the front door: 1 East 70th Street.
