⏫Support is an area for price , where it halts due to demand of the stock at that price .
⏬Resistance is an area for price ,where it halts due to Supply of the stock at that price .
1/n


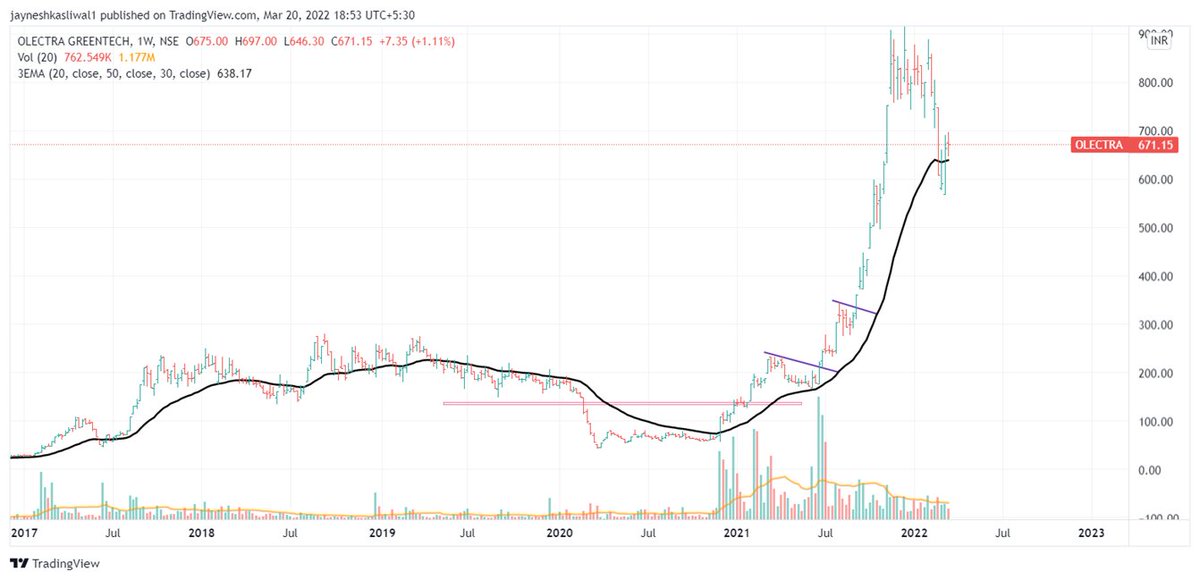
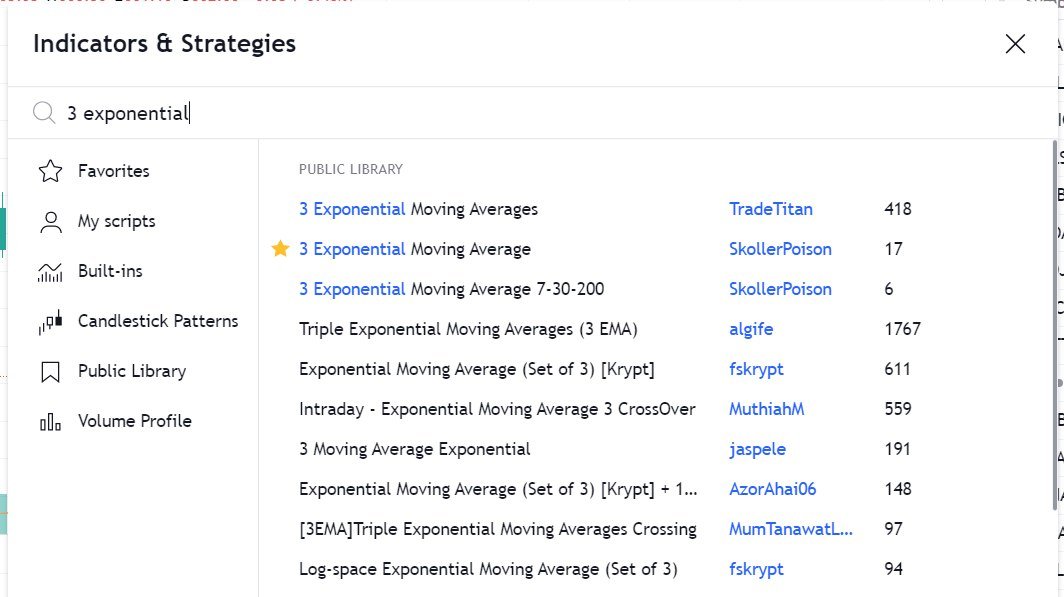
The Ultimate Guide to moving averages !
— JayneshKasliwal (@JayneshKasliwal) November 30, 2021
A mega thread to understand the Use of 21 , 50 and 200 ema.
4 Effective uses of Exponential Moving Averages !
Retweet and Share \U0001f504#stockmarkets #nifty @kuttrapali26 @caniravkaria
A Thread on indicator : ADX
— JayneshKasliwal (@JayneshKasliwal) January 1, 2022
Average Directional Index a Quick Guide
Retweet Share !@Techno_Charts
1/n pic.twitter.com/wRvQo5JNKN
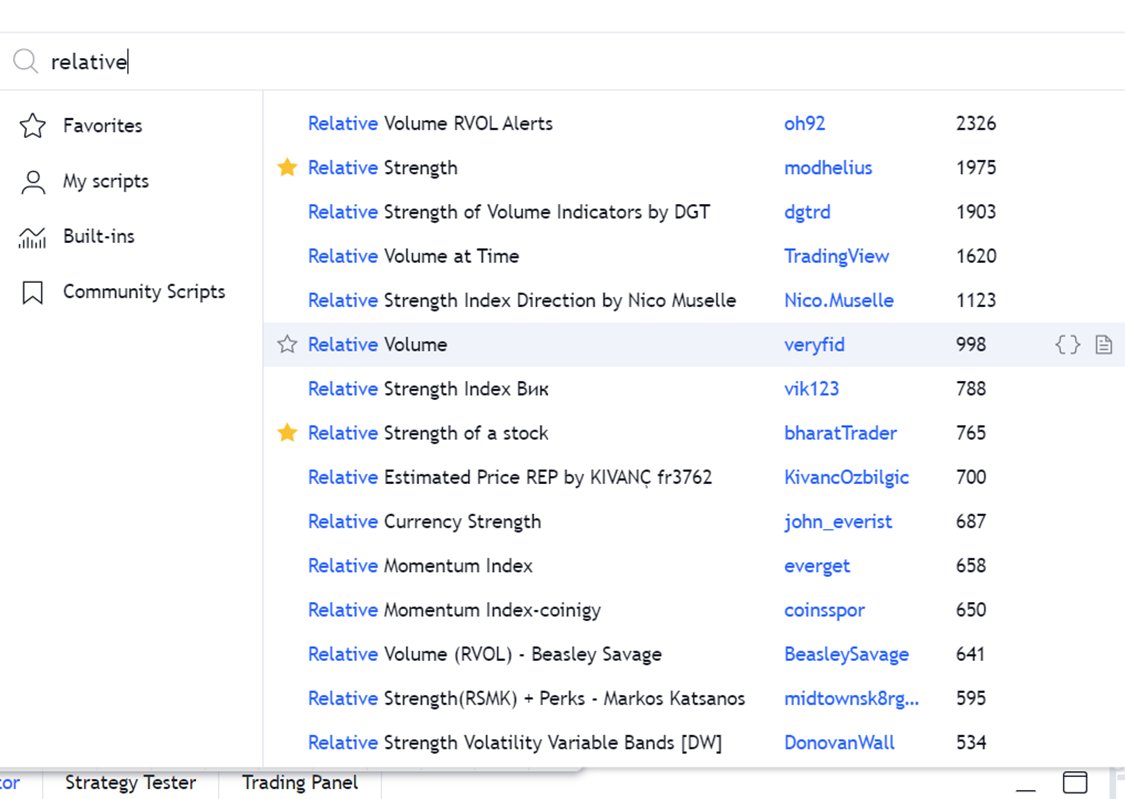
A Mega Thread on RELATIVE STRENGTH
— JayneshKasliwal (@JayneshKasliwal) January 10, 2022
A method to improve
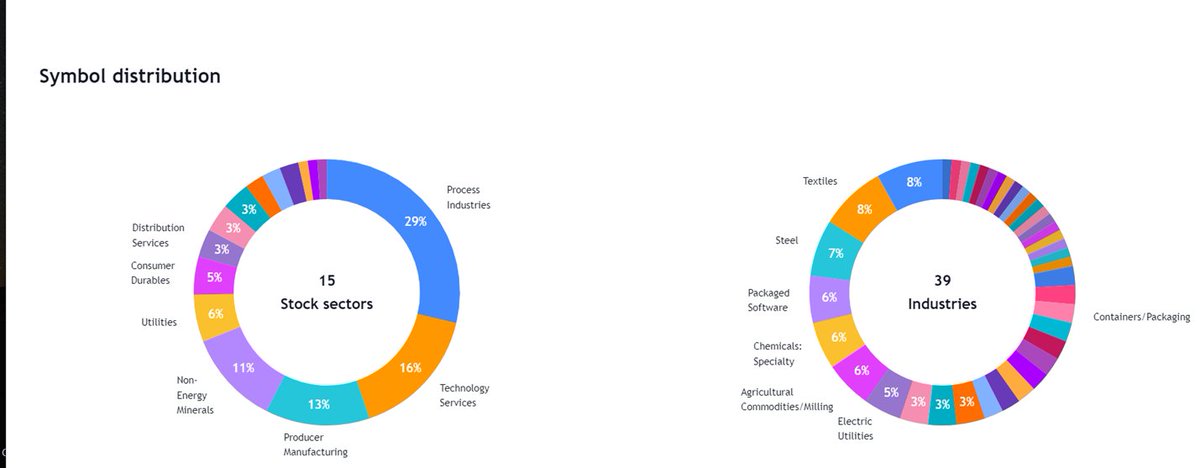
Stock Selection and Conviction in trades
Retweet \U0001f504And Follow @JayneshKasliwal


Drive Link for
— JayneshKasliwal (@JayneshKasliwal) November 5, 2021
Custom Made Pdfs on
1. Trading Strategies
2. Stock Selection
3. Tradingview Free Tutorial
4. Psychology https://t.co/9ukwfjLDYT
Retweet Share !@kuttrapali26 @MarketScientist @AmitabhJha3