Authors JayneshKasliwal

1. Moving Averages Ultimate Guide
2. All About ADX
3. Super Performance Using RELATIVE STRENGTH
Retweet and Share
Moving Average
The Ultimate Guide to moving averages !
— JayneshKasliwal (@JayneshKasliwal) November 30, 2021
A mega thread to understand the Use of 21 , 50 and 200 ema.
4 Effective uses of Exponential Moving Averages !
Retweet and Share \U0001f504#stockmarkets #nifty @kuttrapali26 @caniravkaria
All about
A Thread on indicator : ADX
— JayneshKasliwal (@JayneshKasliwal) January 1, 2022
Average Directional Index a Quick Guide
Retweet Share !@Techno_Charts
1/n pic.twitter.com/wRvQo5JNKN
Super Performance Using RELATIVE STRENGTH
A Mega Thread on RELATIVE STRENGTH
— JayneshKasliwal (@JayneshKasliwal) January 10, 2022
A method to improve
Stock Selection and Conviction in trades
Retweet \U0001f504And Follow @JayneshKasliwal


Option Strategies free of cost
Here is a thread of all 🧵
A Retweet would help :)
Begin Your Algo Trading Journey
https://t.co/xIA6SIgGRj
1/n

Banknifty Option Selling Strategy :
https://t.co/r6vxQY212o
2/n

Banknifty option Buying :
https://t.co/w3QukixFD2
3/n
Advanced Intraday Strangle :
https://t.co/v1KynrLb03
4/n

A Mega Thread🧵
Concepts :
Relative Strength
Stage Analysis
Retweet and Comment If you want a PDF
We have Got around 86 Stocks that became 5X in 2 years
These Belonged to various sectors and Groups
Excel Link for List of Stocks
https://t.co/jESOUMlbpd
( As on 30th March 2022)
[1/n]
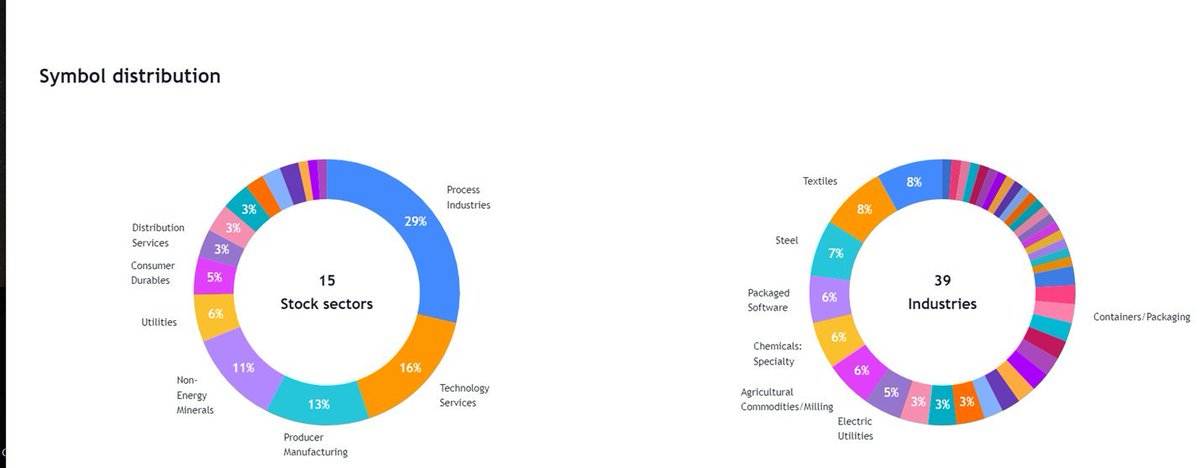
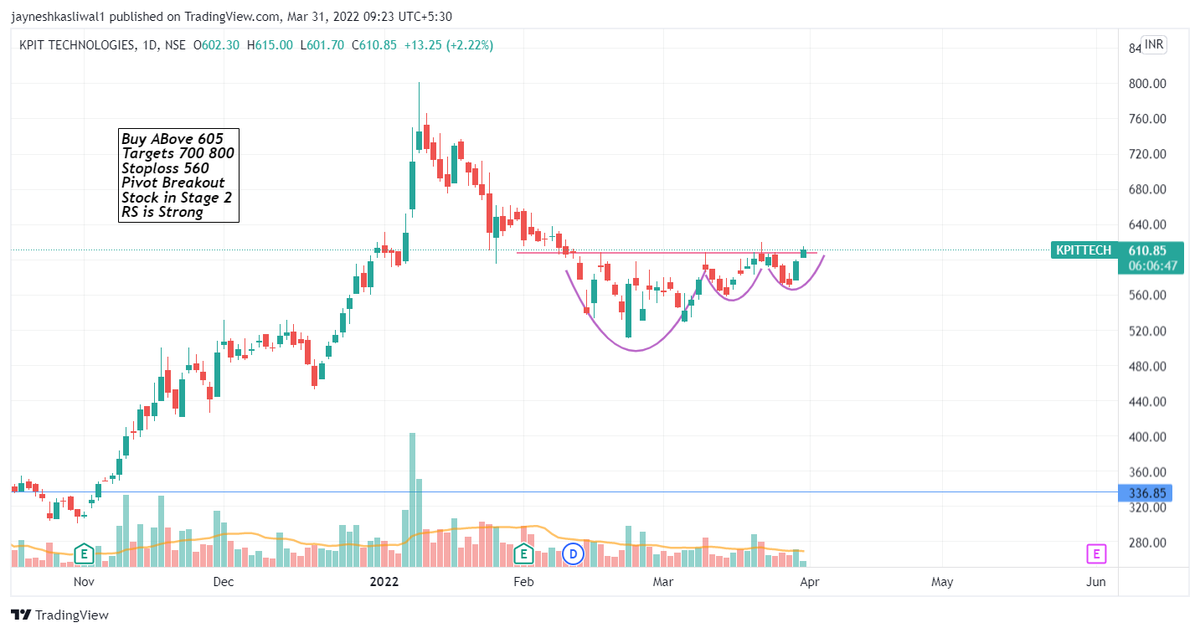
All stocks had few things in common :
Stocks doubled Before entering into Stage 2 Uptrend
52 week RS was positive in stage 2
90% stocks even gave all time high breakout after Stage 2
60 Stocks had market cap less than 1000 Cr
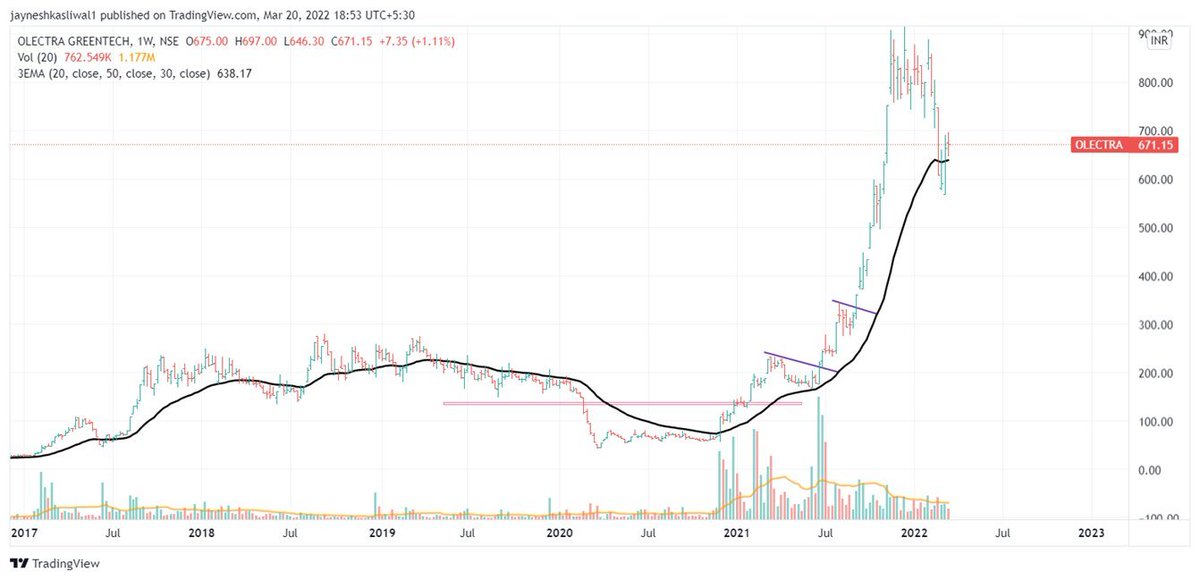
Examples : OLECTRA , PGEL
[2/n]
So What is Relative Strength ?
Relative strength is a strategy used in momentum investing and in identifying value stocks.
It focuses on investing in stocks or other investments that have performed well relative to the market as a whole or to a relevant benchmark.
[3/n]
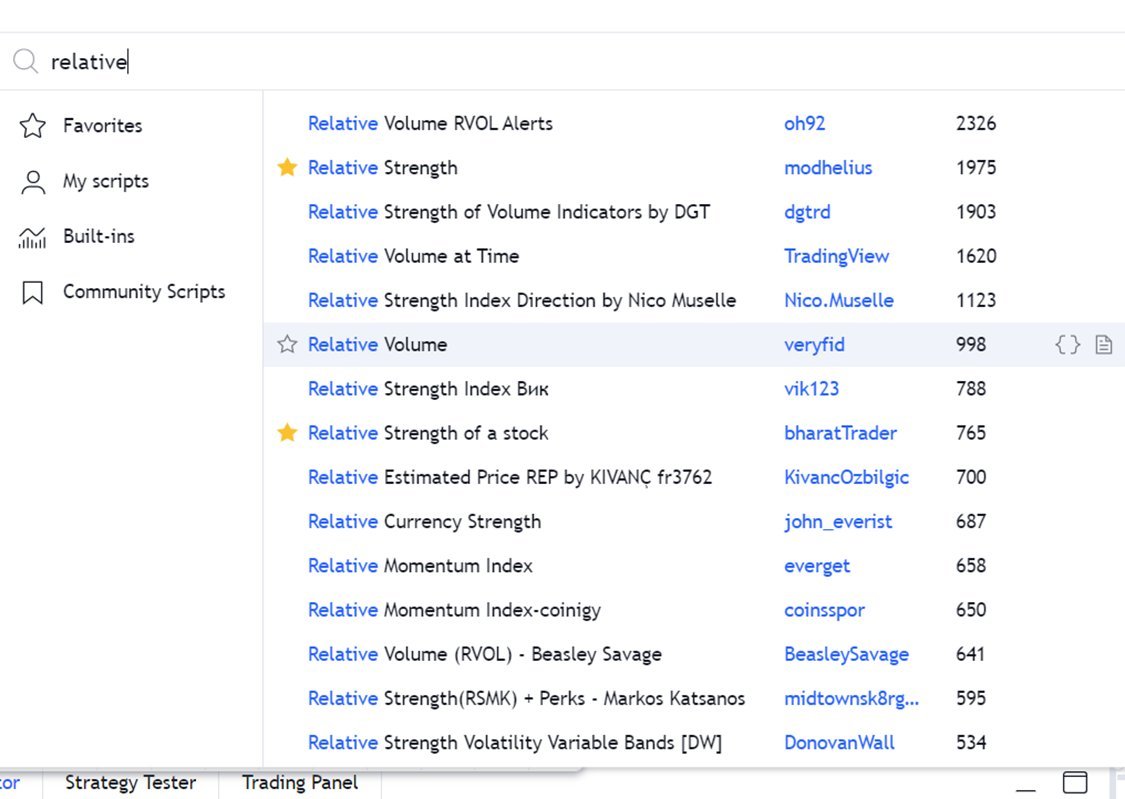
How to Apply ?
Type
“Relative Strength”
Choose any
By bharattrader
By traderlion
By Modhelius
I use by bharattrader
In setting use 52 period
Use Weekly Chart
4/n
📌Rs + Macd Strategy
📌Darvas Box Strategy
📌Breakout Trading
📌Retest Trading
📌Range Trading
Retweet and Share !
@kuttrapali26 @Techno_Charts
1/no
RS + MACD Strategy
Swing Trading Strategy
— JayneshKasliwal (@JayneshKasliwal) November 12, 2021
That can help you generate 3 to 5% Monthly
A thread \U0001f4d5
Using RS , MACD , 21 EMA and Price Action
All Concepts Explained !
RETWEET AND SHARE !#StockMarket @kuttrapali26 @ArjunB9591
1/n
Range Trading Strategy
SWING TRADING STRATEGY FOR RANGE BOUND STOCKS
— JayneshKasliwal (@JayneshKasliwal) December 23, 2021
A Thread :
Using Concept of Support and Resistance
Using Minimum StopLoss
Retweet And Share !
1/n
Darvas Box Trading Strategy
The Darvas Box Trading Strategy
— JayneshKasliwal (@JayneshKasliwal) December 30, 2021
A Detailed Thread \U0001f516 + 1 Book Give Away !
Rules For Giveaway :
Follow @JayneshKasliwal
\U0001f504Retweet and
\u2665\ufe0f Like this Tweet
One Lucky Winner will be Selected in Live for the Giveaway #StockMarket #darvasbox pic.twitter.com/pYdofszMML
Breakout Trading
Breakout Trading Strategy
— JayneshKasliwal (@JayneshKasliwal) November 17, 2021
How to Trade Breakouts Effectively?
How to avoid Big losses in BO Failures ?
How to Position Size?
A THREAD\U0001f516
RETWEET SHARE!\U0001f504@kuttrapali26 @AdityaTodmal
1/n
🧵 Thread 🧵
[1/15]
𝗖𝗵𝗮𝗿𝘁𝗶𝗻𝗸 𝗦𝗰𝗿𝗲𝗲𝗻𝗲𝗿 is a Stock screening tool that is useful to screen stocks based on Technical & Fundamentals.
🔸 It scans stocks by using technical indicators like RSI, MACD, divergences, etc.
🔸 It also uses fundamental tools like Book Value, EPS,PE etc
[2/15]
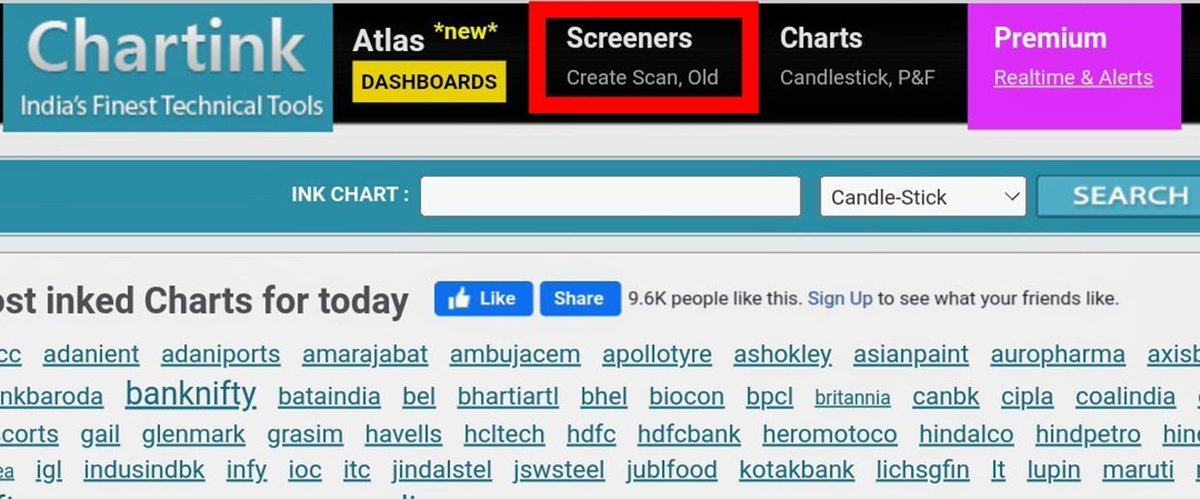
How To Create A Scan ?
Go to https://t.co/nQ7t44bt9T & click on 𝘊𝘳𝘦𝘢𝘵𝘦 𝘚𝘤𝘢𝘯 under 𝘚𝘤𝘳𝘦𝘦𝘯𝘦𝘳𝘴.
[3/15]
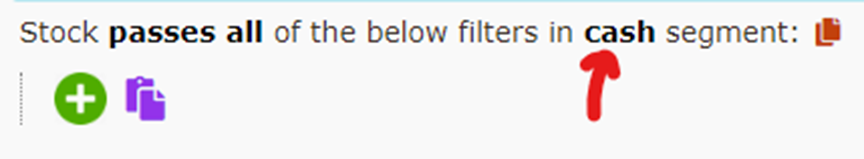
𝗙𝗶𝗿𝘀𝘁 𝗦𝘁𝗲𝗽 𝗧𝗼 𝗙𝗶𝗹𝘁𝗲𝗿 𝗦𝘁𝗼𝗰𝗸𝘀
We can select segments of stocks of our choice, e.g. cash or futures stocks, Nifty 100 etc.
Click on green ‘+’ icon to add conditions.
[4/15]
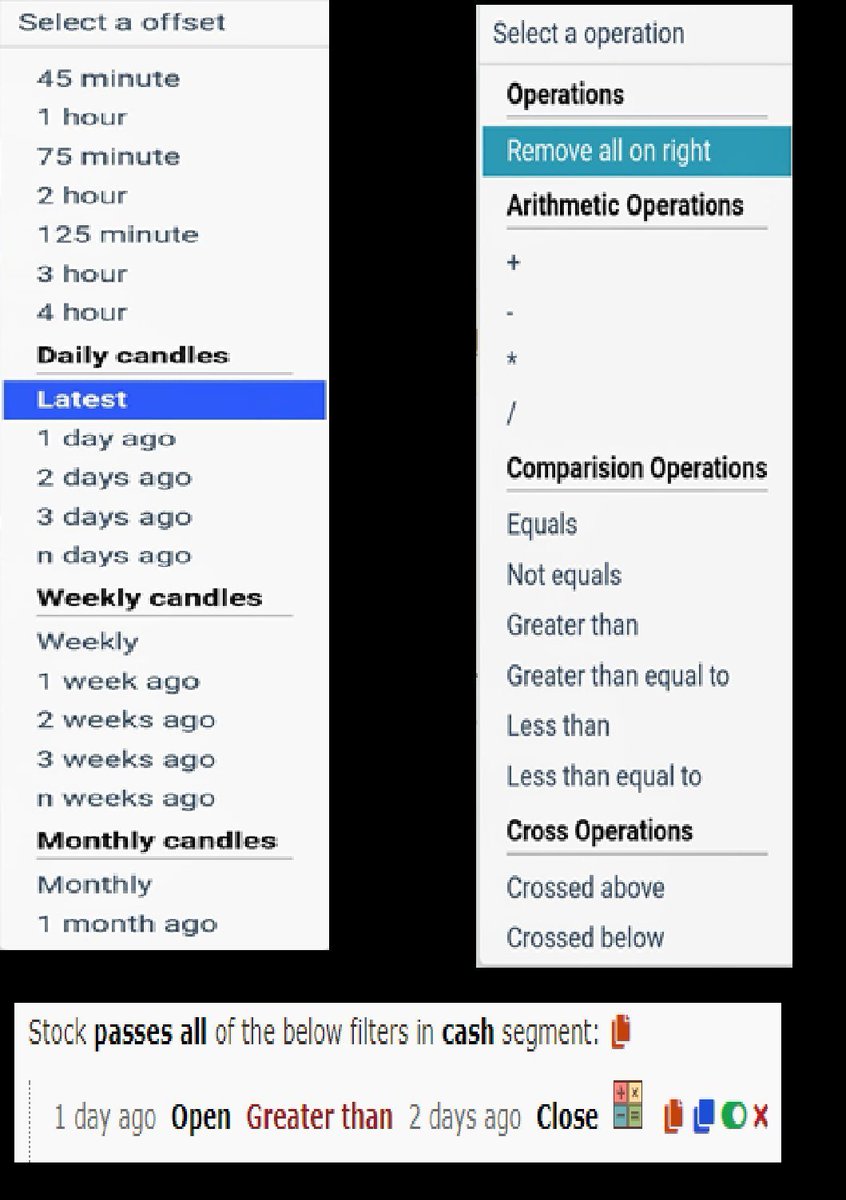
𝗖𝗮𝗻𝗱𝗹𝗲 𝗧𝗶𝗺𝗲𝗳𝗿𝗮𝗺𝗲𝘀 & 𝗖𝗼𝗺𝗽𝗮𝗿𝗶𝘀𝗼𝗻 𝗢𝗽𝗲𝗿𝗮𝘁𝗼𝗿𝘀
🔸 We can select any timeframe of candles in Chartink, from minutes to years.
🔸 And compare two candles using comparison operators like 𝘌𝘲𝘶𝘢𝘭 𝘵𝘰 or 𝘎𝘳𝘦𝘢𝘵𝘦𝘳 𝘛𝘩𝘢𝘯 , crossovers etc
[5/15]