SaiTeja01011's Categories
SaiTeja01011's Authors


Latest Saves
🧵...
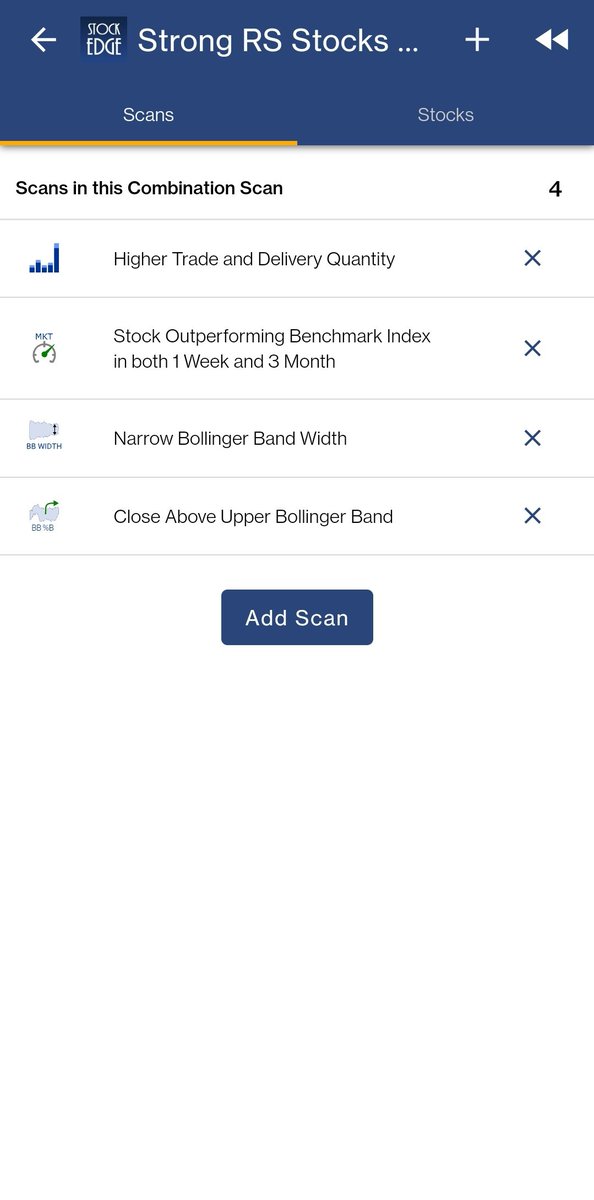
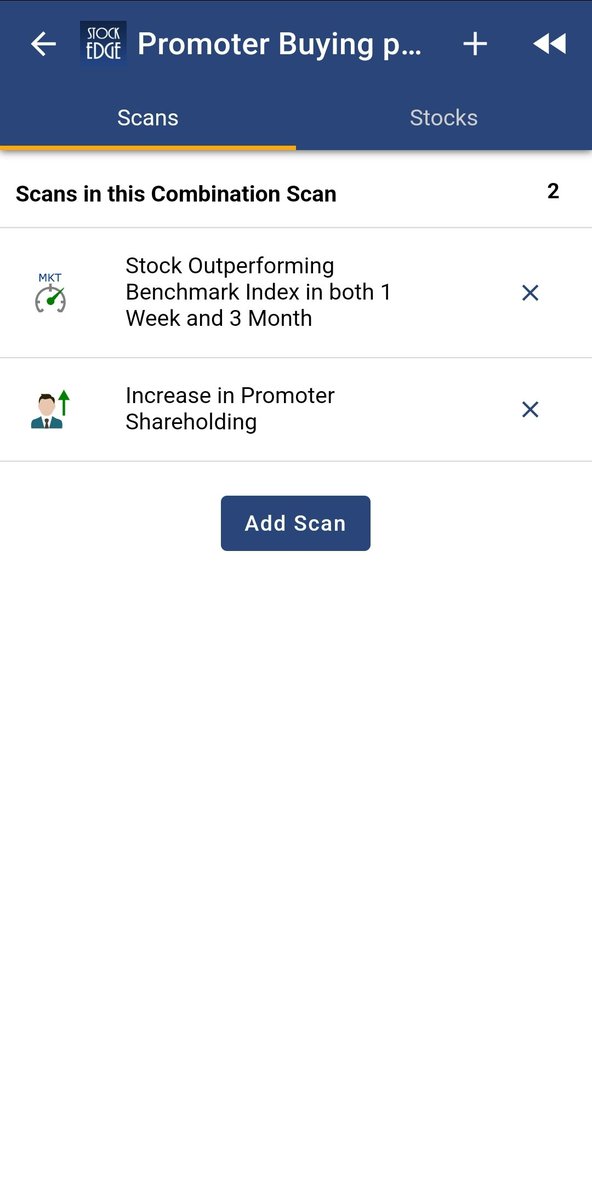
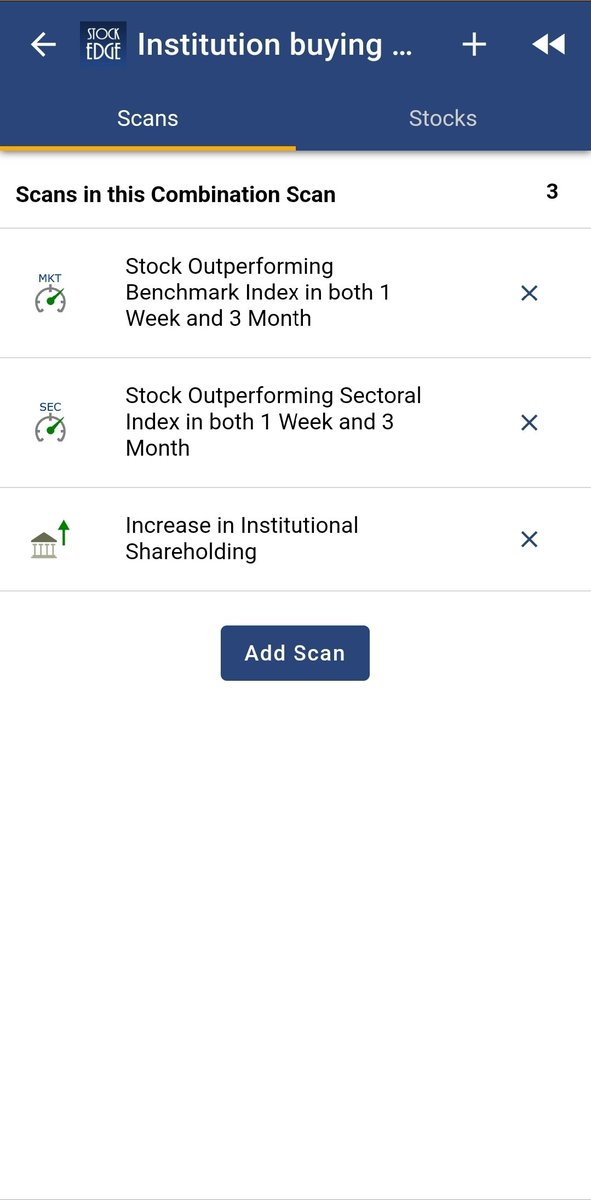
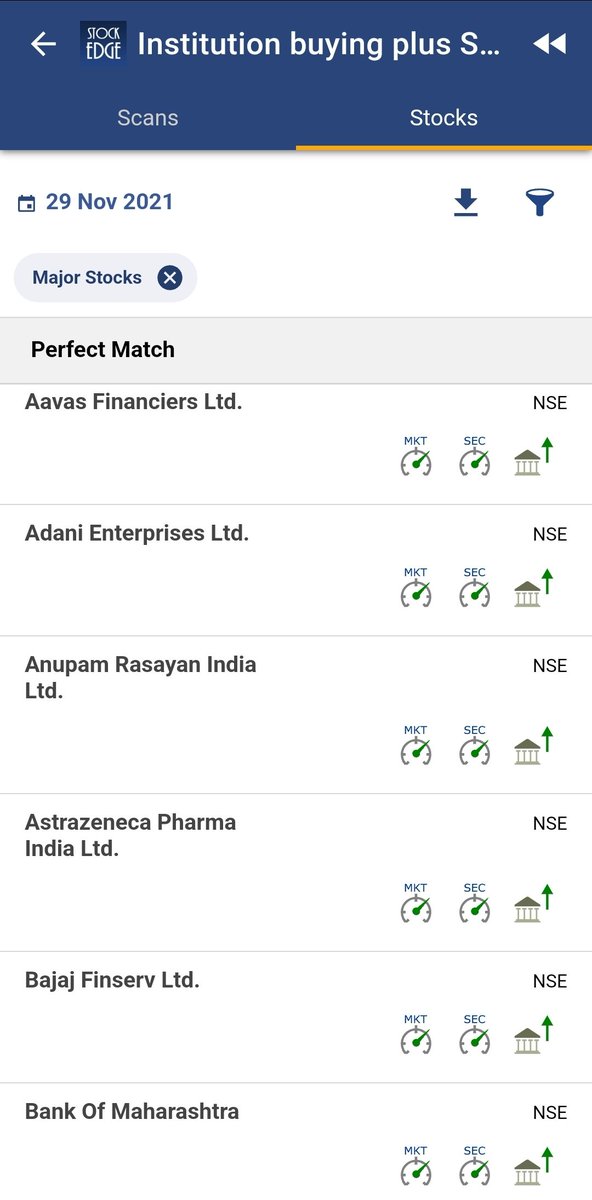
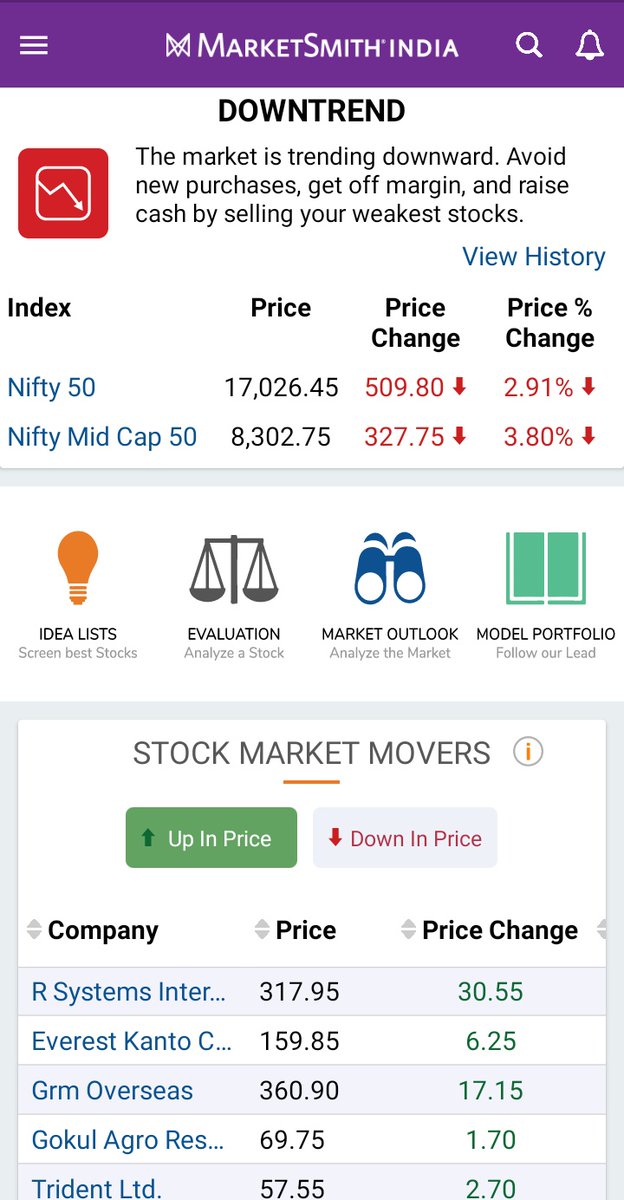
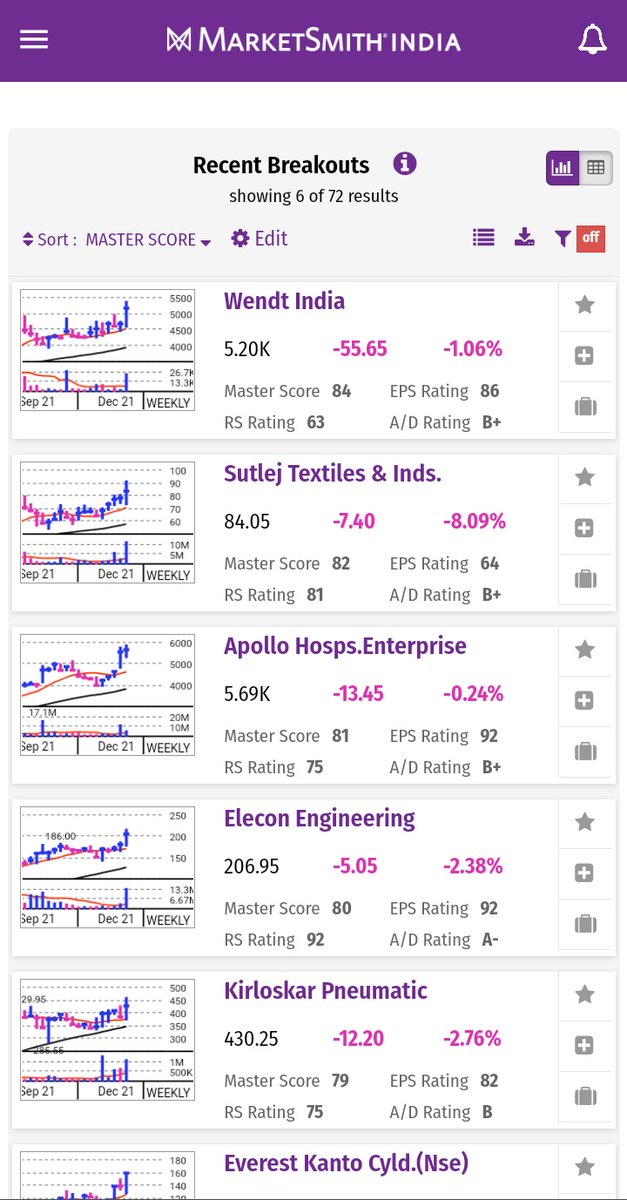
This combination scan identifies stocks that are outperforming Benchmark Indices in 1 week as well as 3 months time frame.
It also identities stocks that have consolidated in a narrow range for some time and breaks the zone with a higher trade & delivery quantity.
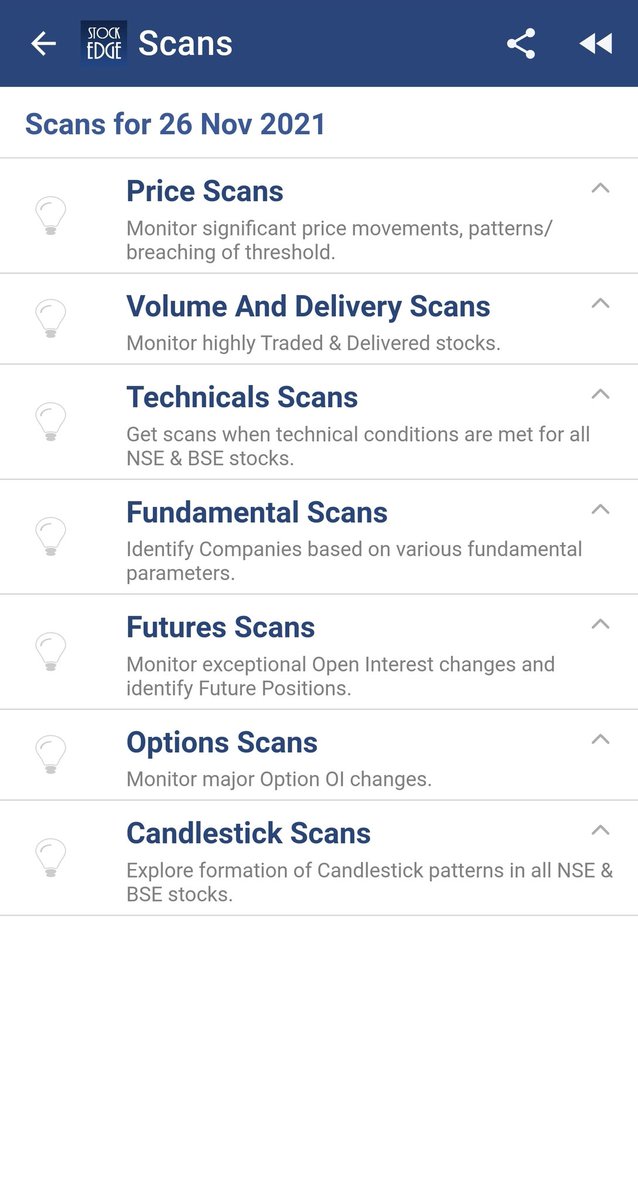
Some of the scans used in the combination include
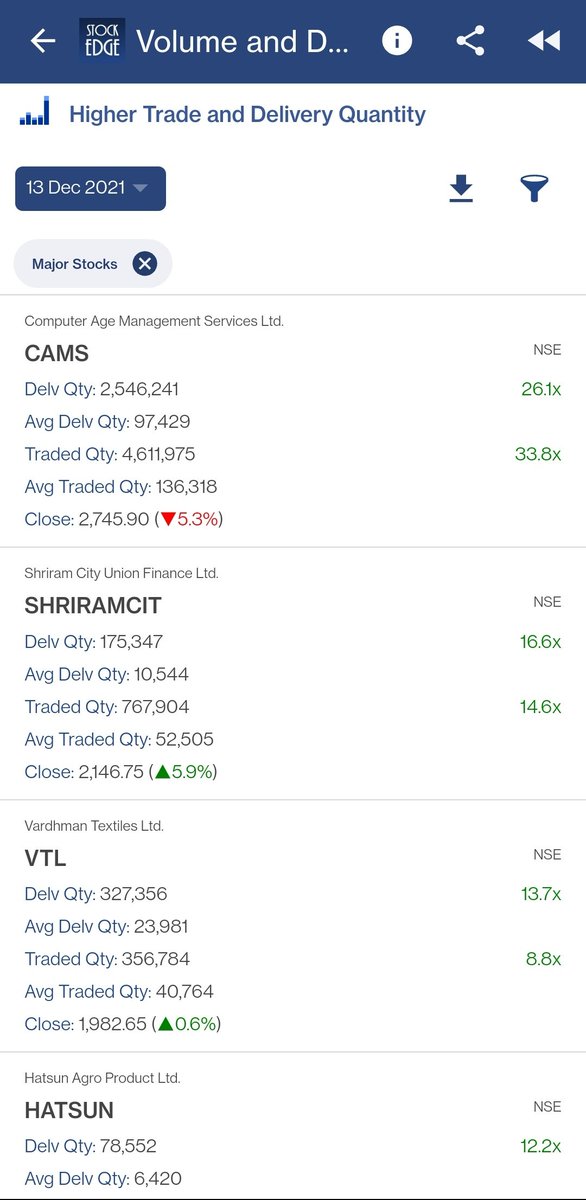
-Higher Trade and Delivery Quantity https://t.co/9CiSwEADrF
The second scan used here is Stocks Outperforming Benchmark Index in both 1 week and 3 month: https://t.co/dv9e3KK810
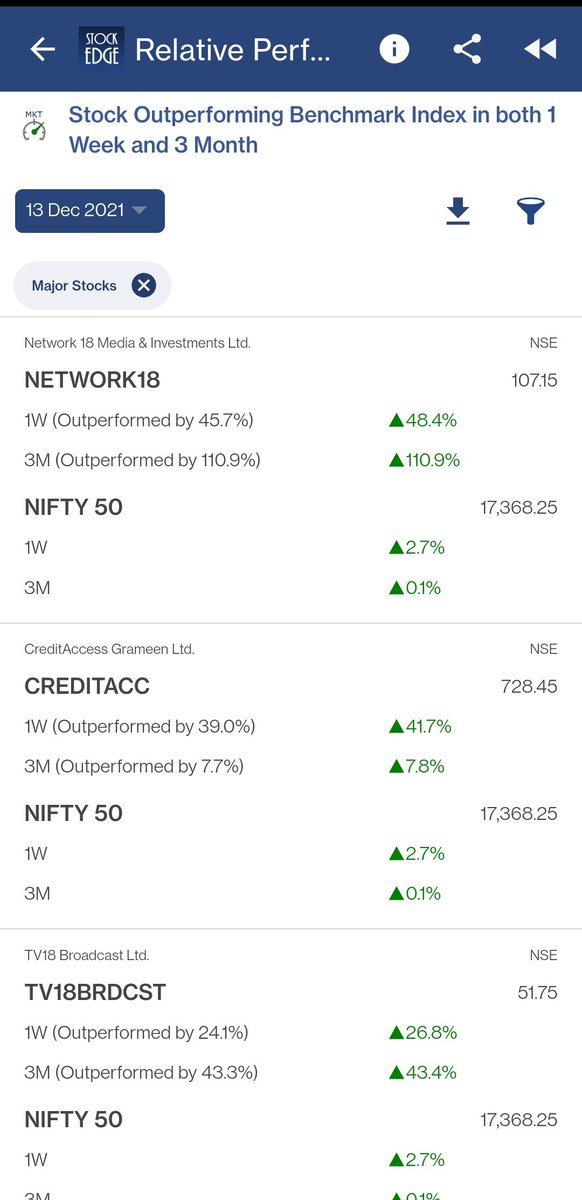
(🧵): https://t.co/6tUmyhrw47
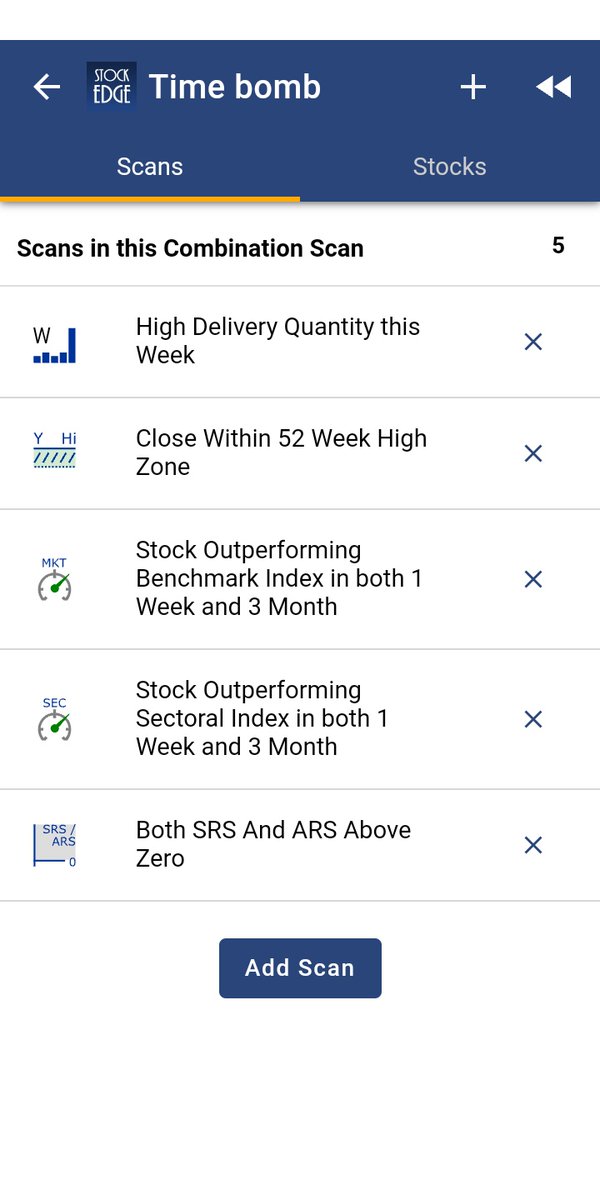
Stocks with a High Delivery, combined with a Close Within 52 week Zone are signs of strong momentum! https://t.co/arNYJst06d
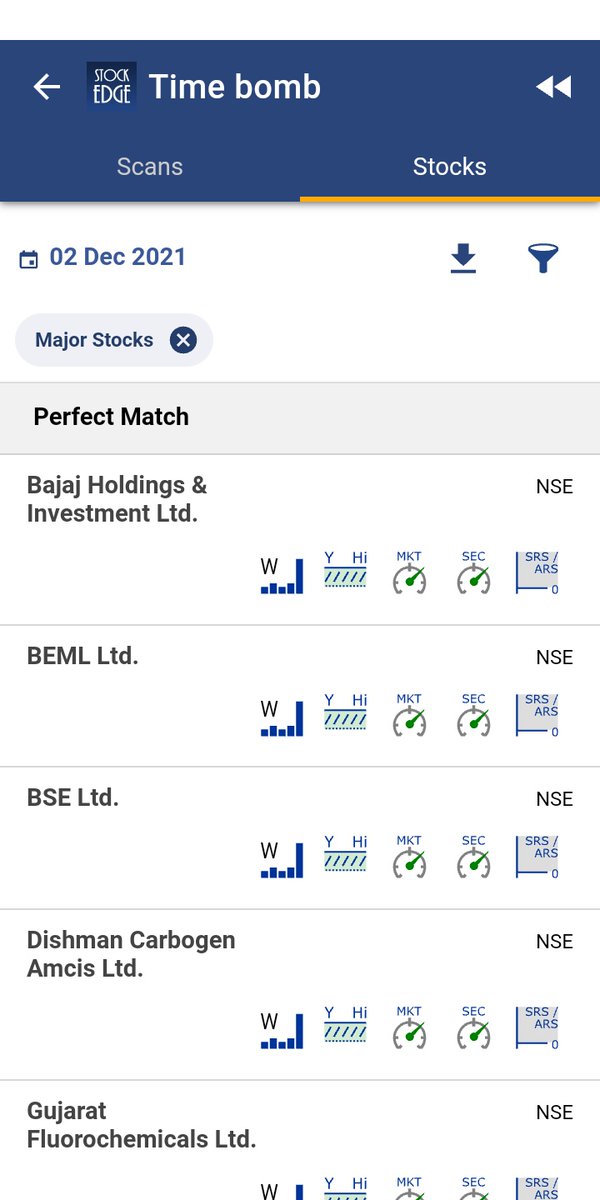
Relative Strength is a momentum indicator which signifies the ratio of a stock price performance compared to the market average performance:
Both Adaptive Relative Strength(ARS) and Static Relative Strength(SRS) above zero confirms its performance as better than Benchmark indexes!
Want to filter such stocks? Subscribe to StockEdge Premium and get these with a few clicks: https://t.co/5hmmLuqUFI
Use Code PREMIUM20 for 20% OFF!


A thread 🔖
Tradingview is one of the most used Trading Websites in the world used by most traders .
Retweet Share !
@kuttrapali26 @AmitabhJha3
#stockstowatch #StockMarketindia
1/n
Trick to Add Unlimited Watchlists in
#Tradingview free Version
Step 1 : Open Trading View Mobile App
Step 2 : Click on " + "
Step 3 : Create Watchlist
This works only on Mobile app
After making Watchlist on Mobile app you can add stocks in Website also .
2/n

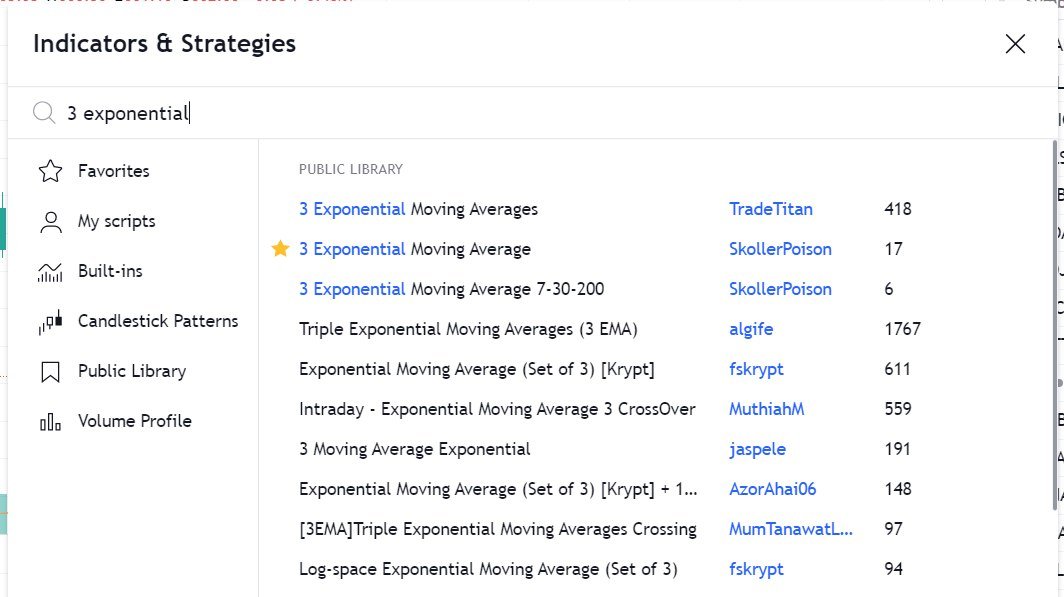
HOW TO APPLY MORE THAN 3 MOVING AVERAGES IN #TradingView Free Version
Step 1 : Just Write "3 expo "
You will get multiple Options
Select "skollerposion"
Step 2 : TO add Normal moving Averages refer the 2nd Picture
Add other indicators as your own
3/n
Link for Tradingview Free tutorial :
https://t.co/jx2gJEEC0t
Watchlist of FnO Midcap Largecaps etc shared
Copy watchlist from the folder and paste it through webiste only .
Copy Paste doesnt work in App
4/n
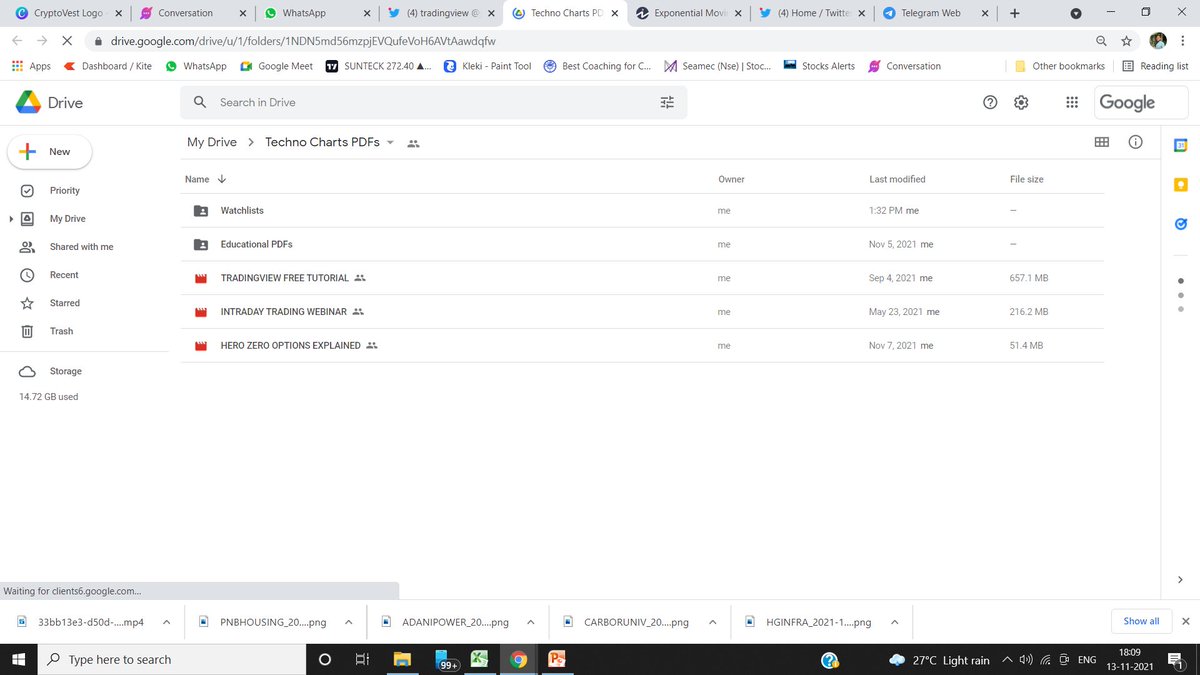
Drive Link for
— JayneshKasliwal (@JayneshKasliwal) November 5, 2021
Custom Made Pdfs on
1. Trading Strategies
2. Stock Selection
3. Tradingview Free Tutorial
4. Psychology https://t.co/9ukwfjLDYT
Retweet Share !@kuttrapali26 @MarketScientist @AmitabhJha3

This learning thread would be on
"𝙐𝙨𝙚𝙨 𝙤𝙛 𝙍𝙚𝙡𝙖𝙩𝙞𝙫𝙚 𝙎𝙩𝙧𝙚𝙣𝙜𝙩𝙝"
Shared some strategy.
Like👍 & Retweet🔄for wider reach and for more such learning thread in the future.
1/22
Most of us would confuse it with Relative Strength Index (RSI) but Relative Strength is a different indicator.
We have already covered about "Uses of RSI" in below thread👇
https://t.co/oTOrW7joNI
One can go through this if you haven't.
2/22
#RSI is a common indicator which most of us use in the stock market.
— Yash Mehta (@YMehta_) October 22, 2021
This learning thread would be on
"\U0001d650\U0001d668\U0001d65a\U0001d668 \U0001d664\U0001d65b \U0001d64d\U0001d64e\U0001d644"
Like\U0001f44d & Retweet\U0001f504 for wider reach and for more such learning thread in the future.
Also, an investment strategy is shared using RSI in the end.
1/16
Now coming to Relative Strength (RS).
It is basically a strategy used in momentum investing which shows strength or weakness between two asset classes (two stocks, index, commodity).
One can read about this in below
As of now, I am using this indicator on .@tradingview platform.
It's free and one can add it in their Tradingview account as well, using this link👇
https://t.co/FxCjJFsNOG
There are multiple variants in this as well. Some traders use multiple time frame RS.
4/22
RS basically compares returns of one stock/index with the returns of benchmark stock/index at a particular time horizon.
Let's say, I want to analyze TCS and Benchmark Index is Nifty.
5/22

This will give u all details (well almost all!) about YOUR financial transactions during the year
This is a thread to tell u what it is and how do u get the AIS
(1/n)
First of all,
What is AIS (Annual Information Statement)?
You know earlier Income Tax used to give statement 26AS
AIS is a much detailed one - with many more details included - like your Savings Interest, all Mutual Fund txns during the year etc
(2/n)
Will 26AS be stopped?
a) Now you can get both 26AS and also AIS
b) Both put together, Income Tax department knows all your financial txns
c) And it's good as now you will find it very easy to know and submit details for your Income Tax returns
(3/n)
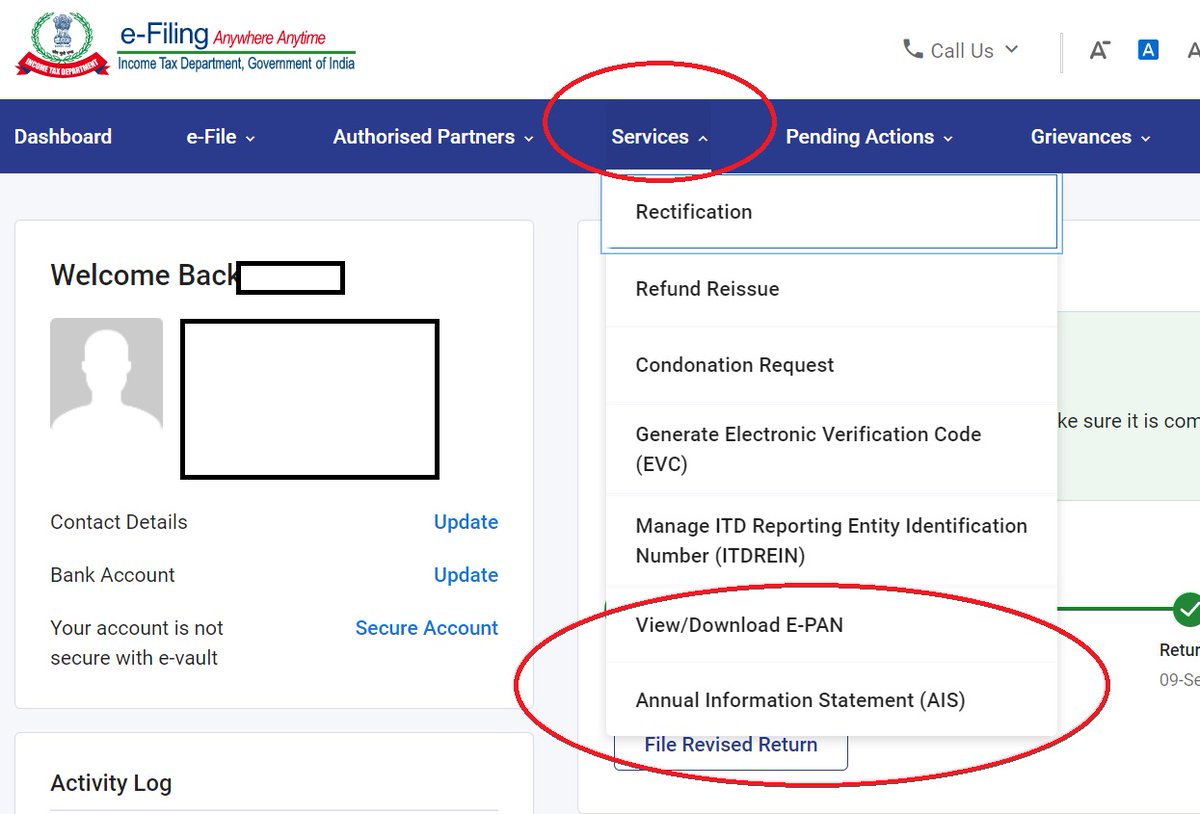
How to access my AIS?
a) Log in to your Income Tax account at https://t.co/WtESV72dHq
b) Go to Services Tab
c) Last option in this tab is the AIS option
Screenshot below
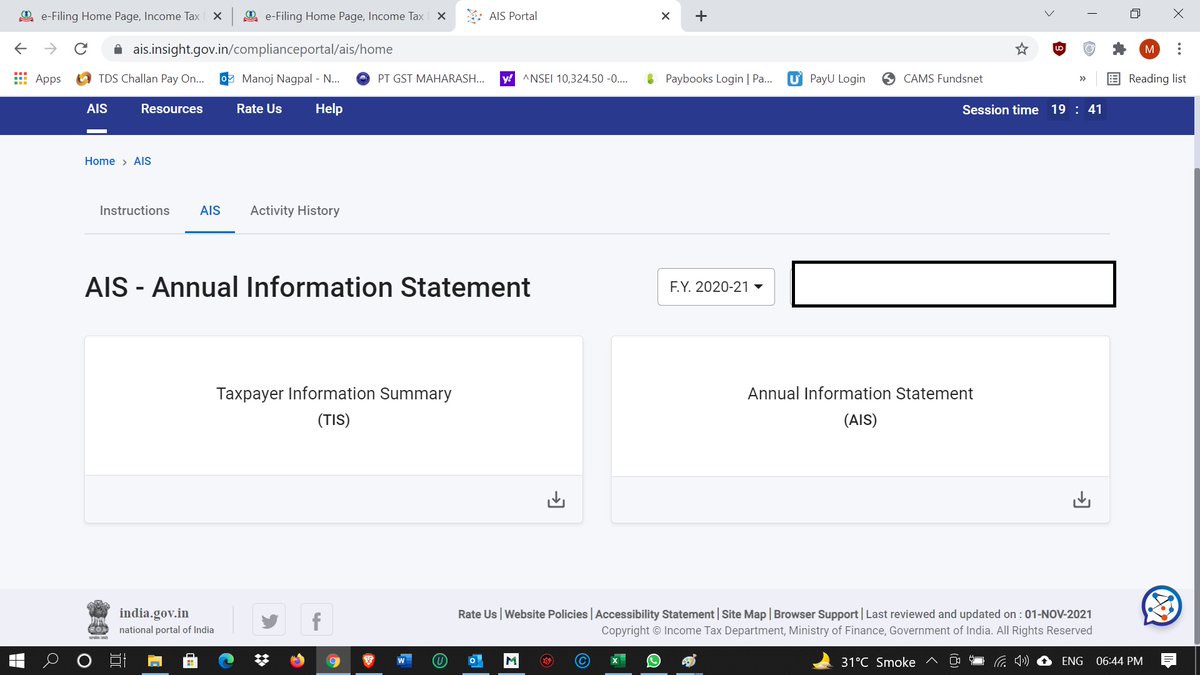
When u click on the AIS option in the above dropdown
it will open a new tab withbelow options
It has two options
a) Left side - Tax Information Summary (TIS)
b) Right side - AIS
Both are the same. TIS is a summary and AIS is the detailed statement. You can download both

1 - open trading view in your browser and select stock scanner in left corner down side .
2 - touch the percentage% gain change ( and u can see higest gainer of today)
Making thread \U0001f9f5 on trading view scanner by which you can select intraday and btst stocks .
— Vikrant (@Trading0secrets) October 22, 2021
In just few hours (Without any watchlist)
Some manual efforts u have to put on it.
Soon going to share the process with u whenever it will be ready .
"How's the josh?"guys \U0001f57a\U0001f3b7\U0001f483
3. Then, start with 6% gainer to 20% gainer and look charts of everyone in daily Timeframe . (For fno selection u can choose 1% to 4% )
4. Then manually select the stocks which are going to give all time high BO or 52 high BO or already given.
5. U can also select those stocks which are going to give range breakout or already given range BO
6 . If in 15 min chart📊 any stock sustaing near BO zone or after BO then select it on your watchlist
7 . Now next day if any stock show momentum u can take trade in it with RM
This looks very easy & simple but,
U will amazed to see it's result if you follow proper risk management.
I did 4x my capital by trading in only momentum stocks.
I will keep sharing such learning thread 🧵 for you 🙏💞🙏
Keep learning / keep sharing 🙏
@AdityaTodmal
Here I will share what I believe are essentials for anybody who is interested in stock markets and the resources to learn them, its from my experience and by no means exhaustive..
First the very basic : The Dow theory, Everybody must have basic understanding of it and must learn to observe High Highs, Higher Lows, Lower Highs and Lowers lows on charts and their
Even those who are more inclined towards fundamental side can also benefit from Dow theory, as it can hint start & end of Bull/Bear runs thereby indication entry and exits.

Next basic is Wyckoff's Theory. It tells how accumulation and distribution happens with regularity and how the market actually
Dow theory is old but
Old is Gold....
— Professor (@DillikiBiili) January 23, 2020
this Bharti Airtel chart is a true copy of the Wyckoff Pattern propounded in 1931....... pic.twitter.com/tQ1PNebq7d


P.S. No one specifically invented ironfly & it's adjustments. A good trader can figure it out on his own. I've been doing it on & off for yrs.
THREAD ON IRONFLY
— Sarang Sood (@SarangSood) December 12, 2020
These days the most preferred strategy for option sellers due to improved margins is IRONFLY. It's essentially a short straddle with long strangle. Long strangle acting as 'WINGS', which help in capping the unlimited risk associated with a short straddle.(1/n)


Great video with points helpful for beginners.
Made 4 threads on DJ Sir with the help of @niki_poojary
1. Selecting strikes to trade in with risk management.
2. How he took some aggressive trades.
3. Multiple charts analysis for intraday trading.
4. Trade Setup
https://t.co/Ngoc5bh906 Thank Mahek bhai for making this video basis my set up which i have been following since past 2 yr I\u2019m not promoting this software, neither I 'll gain any referral if anyone subscribes for this software ,Purpose is to share help fellow traders!\U0001f60a
— itrade(DJ) (@ITRADE191) September 5, 2021
Attaching all threads made on DJ Sir. After watching the video you can refer to this tweet for notes about his strategy and learn a few other ideas.
Compiling these together for easy access to his knowledge.
1. Selecting strikes and risk
5. A THREAD on . . . .
— Aditya Todmal (@AdityaTodmal) July 11, 2021
How @ITRADE191 selects strikes to trade in and how he follows risk management.
Short thread explained via pictures with the help of @niki_poojary.https://t.co/YiYYaIReNS
2. Going aggressive with help of data and
6. Thread on how @ITRADE191 made 3 lakhs in 2 days.
— Aditya Todmal (@AdityaTodmal) July 11, 2021
You will need:
1. Pivots
2. Vwap
3. PDL/PDH (Previous day high/low)
4. Advance/Decline Ratio.https://t.co/o9tLOaLpEh
3. Intraday
7. DJ @ITRADE191 multiple chart analysis for INTRADAY TRADING.
— Aditya Todmal (@AdityaTodmal) July 11, 2021
1. Core setup
2. Pivot points trades
3. PDH/PDL trades
4. Open interest addictions combined with rejections on charts.
5. Website to confirm biashttps://t.co/qZQCWOSisa