More from Learner Vivek Bajaj




More from Stockedge

One of our users submitted a special Scan:
A THREAD(🧵)....(1/7)
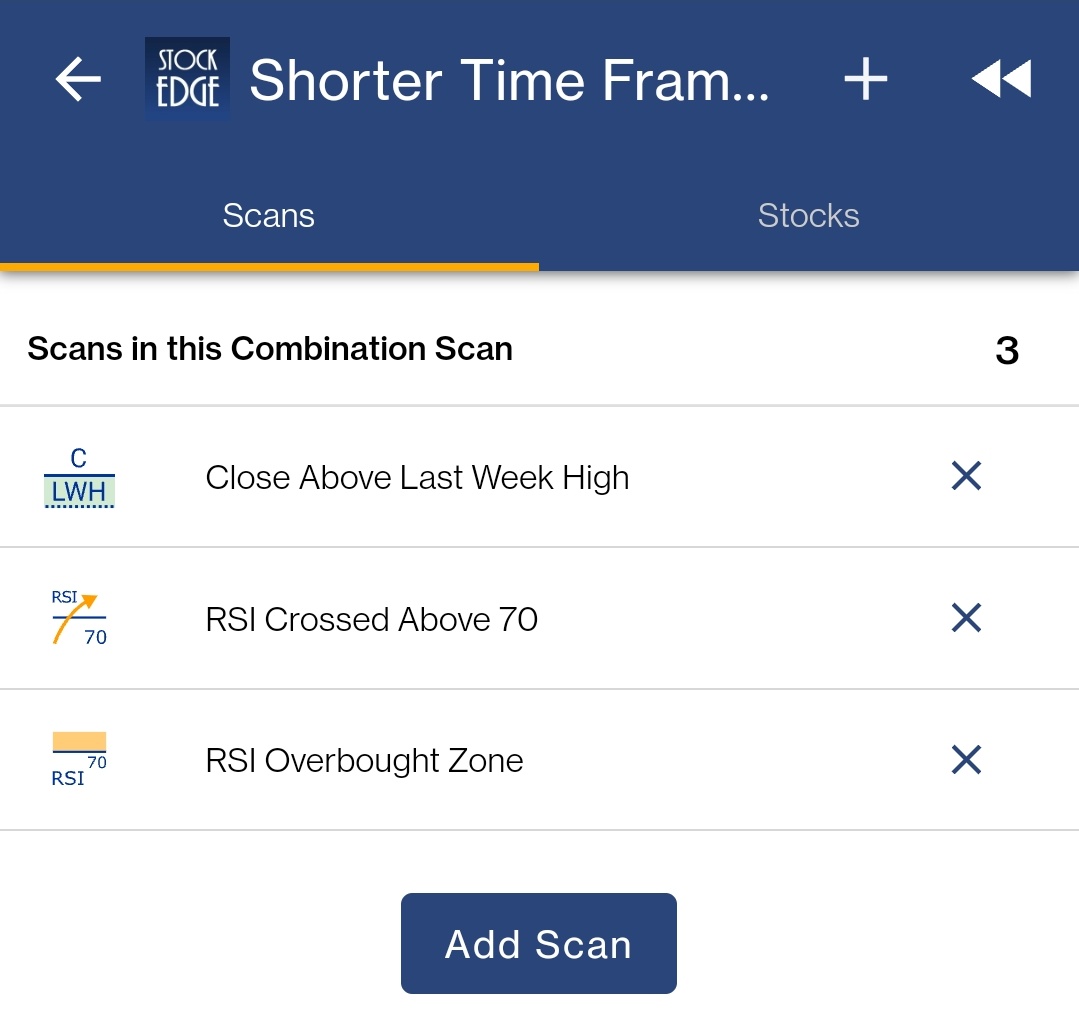
This Combo scan tries to filter stocks based on strong momentum for short term trades
(2/7)
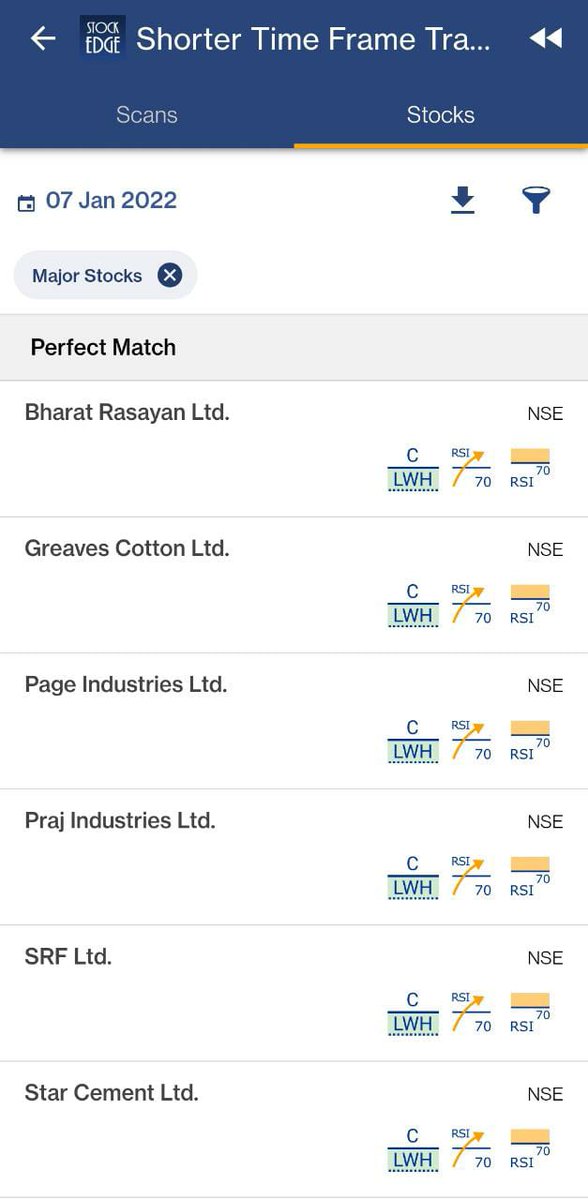
The first scan used here is Close Above Last Week High
https://t.co/ehv5ke8sxc
(3/7)
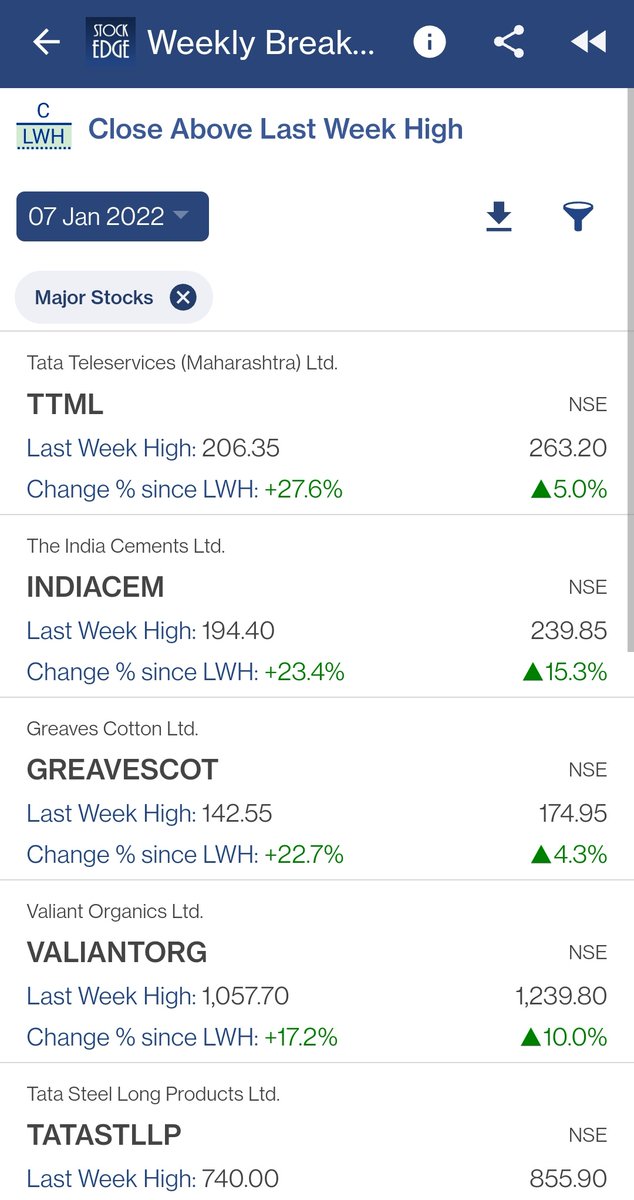
The Second Scan in the combo is RSI Crossed above 70 https://t.co/q4NpyFYuBD
(4/7)
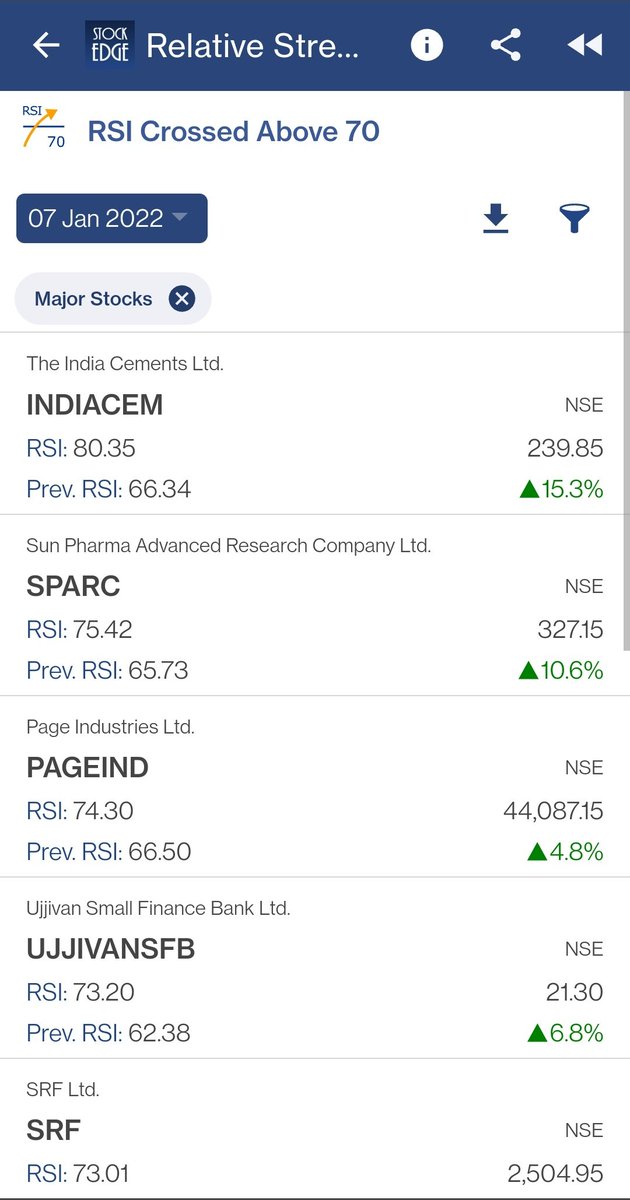
The Third Scan used here is RSI Overbought Zone https://t.co/5uZxwnLAUD
(5/7)
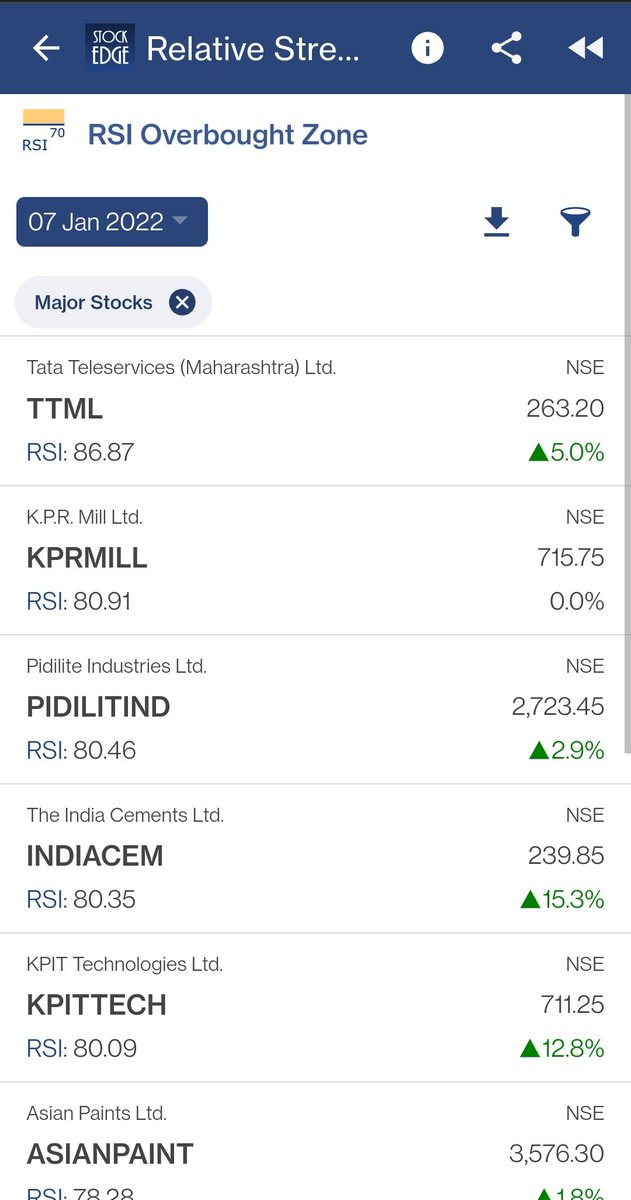
A THREAD(🧵)....(1/7)
This Combo scan tries to filter stocks based on strong momentum for short term trades
(2/7)
The first scan used here is Close Above Last Week High
https://t.co/ehv5ke8sxc
(3/7)
The Second Scan in the combo is RSI Crossed above 70 https://t.co/q4NpyFYuBD
(4/7)
The Third Scan used here is RSI Overbought Zone https://t.co/5uZxwnLAUD
(5/7)


The magic of StockEdge combination scans is that it takes into account the Bullish signs from many aspects!
(🧵): https://t.co/6tUmyhrw47
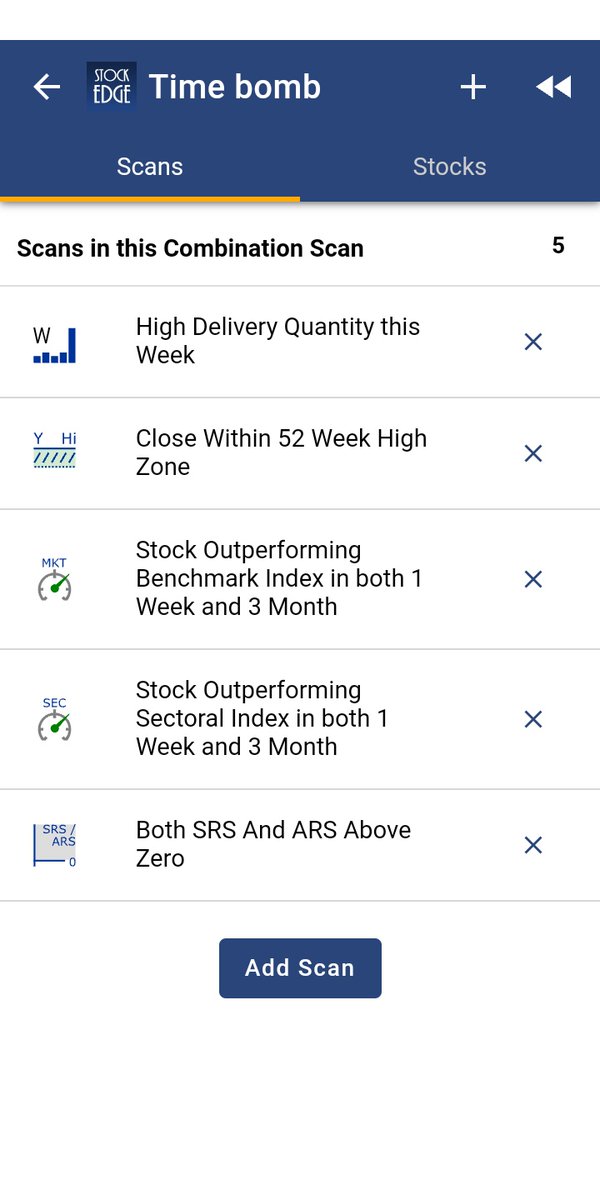
Stocks with a High Delivery, combined with a Close Within 52 week Zone are signs of strong momentum! https://t.co/arNYJst06d
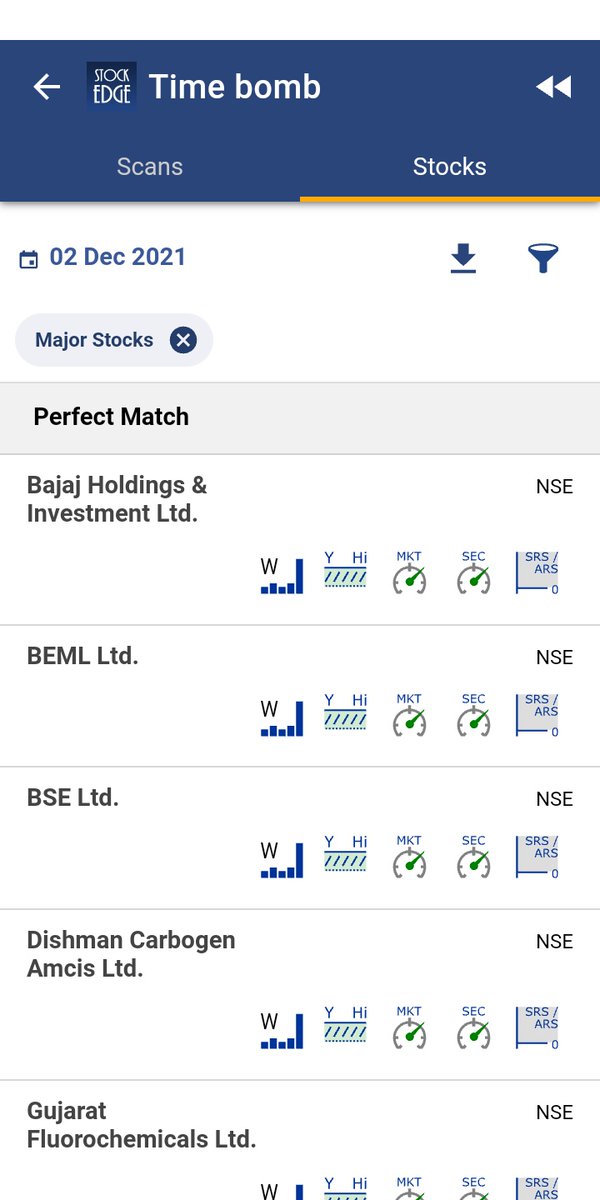
Relative Strength is a momentum indicator which signifies the ratio of a stock price performance compared to the market average performance:
Both Adaptive Relative Strength(ARS) and Static Relative Strength(SRS) above zero confirms its performance as better than Benchmark indexes!
Want to filter such stocks? Subscribe to StockEdge Premium and get these with a few clicks: https://t.co/5hmmLuqUFI
Use Code PREMIUM20 for 20% OFF!
(🧵): https://t.co/6tUmyhrw47
Stocks with a High Delivery, combined with a Close Within 52 week Zone are signs of strong momentum! https://t.co/arNYJst06d
Relative Strength is a momentum indicator which signifies the ratio of a stock price performance compared to the market average performance:
Both Adaptive Relative Strength(ARS) and Static Relative Strength(SRS) above zero confirms its performance as better than Benchmark indexes!
Want to filter such stocks? Subscribe to StockEdge Premium and get these with a few clicks: https://t.co/5hmmLuqUFI
Use Code PREMIUM20 for 20% OFF!


You May Also Like

Trading view scanner process -
1 - open trading view in your browser and select stock scanner in left corner down side .
2 - touch the percentage% gain change ( and u can see higest gainer of today)
3. Then, start with 6% gainer to 20% gainer and look charts of everyone in daily Timeframe . (For fno selection u can choose 1% to 4% )
4. Then manually select the stocks which are going to give all time high BO or 52 high BO or already given.
5. U can also select those stocks which are going to give range breakout or already given range BO
6 . If in 15 min chart📊 any stock sustaing near BO zone or after BO then select it on your watchlist
7 . Now next day if any stock show momentum u can take trade in it with RM
This looks very easy & simple but,
U will amazed to see it's result if you follow proper risk management.
I did 4x my capital by trading in only momentum stocks.
I will keep sharing such learning thread 🧵 for you 🙏💞🙏
Keep learning / keep sharing 🙏
@AdityaTodmal
1 - open trading view in your browser and select stock scanner in left corner down side .
2 - touch the percentage% gain change ( and u can see higest gainer of today)
Making thread \U0001f9f5 on trading view scanner by which you can select intraday and btst stocks .
— Vikrant (@Trading0secrets) October 22, 2021
In just few hours (Without any watchlist)
Some manual efforts u have to put on it.
Soon going to share the process with u whenever it will be ready .
"How's the josh?"guys \U0001f57a\U0001f3b7\U0001f483
3. Then, start with 6% gainer to 20% gainer and look charts of everyone in daily Timeframe . (For fno selection u can choose 1% to 4% )
4. Then manually select the stocks which are going to give all time high BO or 52 high BO or already given.
5. U can also select those stocks which are going to give range breakout or already given range BO
6 . If in 15 min chart📊 any stock sustaing near BO zone or after BO then select it on your watchlist
7 . Now next day if any stock show momentum u can take trade in it with RM
This looks very easy & simple but,
U will amazed to see it's result if you follow proper risk management.
I did 4x my capital by trading in only momentum stocks.
I will keep sharing such learning thread 🧵 for you 🙏💞🙏
Keep learning / keep sharing 🙏
@AdityaTodmal