
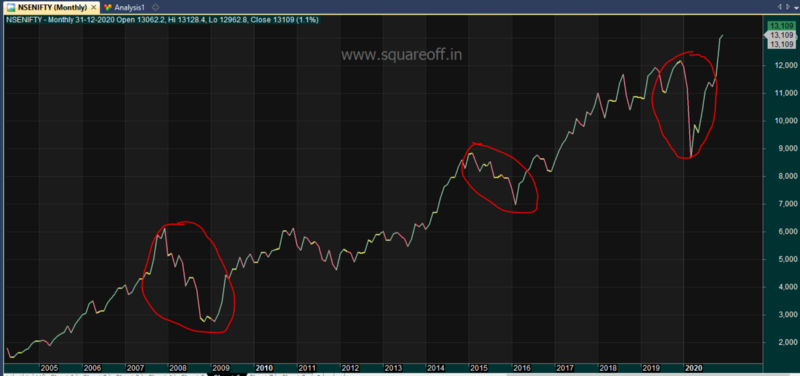
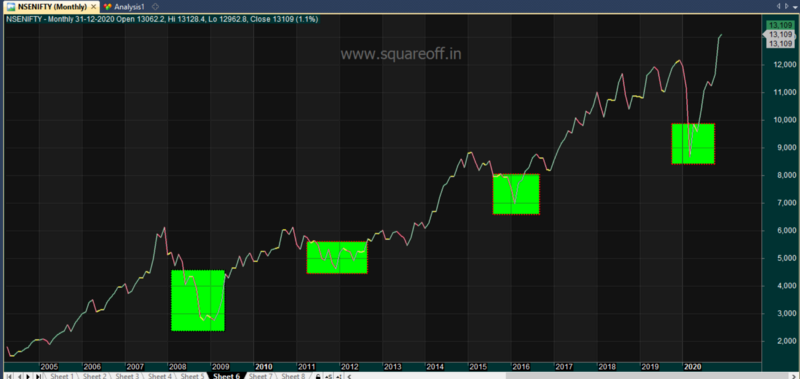
Analyzed last 12 years of historical data to check if there are any patterns we can observe to find the best time to invest in stocks for long term. #Nifty50 #investing #stocks 1/10

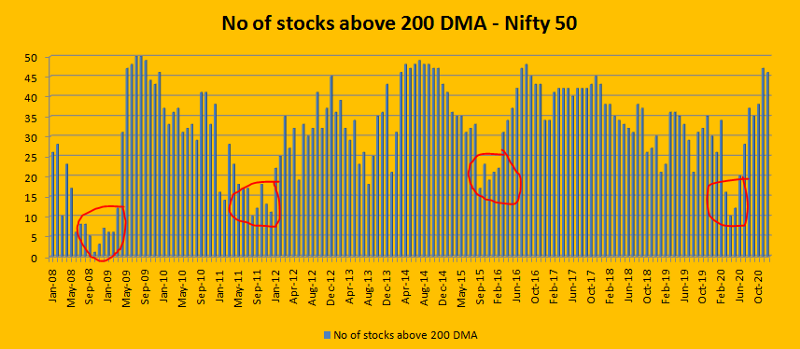
and in the year 2020, its less than 10 stocks, if you compare the above data with below Nifty chart, you can easily conclude that those extreme panic period were the times market bottomed out.
More from Kirubakaran Rajendran
I have been watching movies from a very early age and I just love it. Watching a good movie makes you forget that you are actually watching a movie. Here's a master thread about reviews of all the movies I have shared in twitter so far.Trying to find a weekend movie? Here it is

https://t.co/gjTHTKyyb2
https://t.co/ZCNxllFLB0
https://t.co/uqlAlXdFga
https://t.co/wMf9Q0G6uY
https://t.co/gjTHTKyyb2
It Ain\u2019t What You Don\u2019t Know That Gets You Into Trouble. It\u2019s What You Know for Sure That Just Ain\u2019t So. Watching #TheBigShort
— Kirubakaran Rajendran (@kirubaakaran) March 14, 2020
Perfect movie for this weekend in current market scenario. pic.twitter.com/OuW1ERAztx
https://t.co/ZCNxllFLB0
When U think of Cars, if #FastAndFurious what comes to your mind, then this movie is not for you. Instead if #Rush movie comes to your mind, then definitely #FordVsFerrai is for you. What an amazing movie, Matt & Bale performance was top notch. Must watch movie. pic.twitter.com/KTGAEhLu9V
— Kirubakaran Rajendran (@kirubaakaran) November 19, 2019
https://t.co/uqlAlXdFga
If you haven\u2019t watched this movie, check it out. The China Hustle. Fantastic documentary that covers about how bogus Chinese firms made millions with IPO, how they tackled these satellite tracking. https://t.co/nC3MTxFpZo pic.twitter.com/3iuhFpOA45
— Kirubakaran Rajendran (@kirubaakaran) April 3, 2020
https://t.co/wMf9Q0G6uY
#SooraraiPottru Entrepreneurship is living a few years of your life like most people won\u2019t, so that you can spend the rest of your life like most people can\u2019t.\u201d No business is inferior to one another. Most inspiring Tamil movie in recent times, Vera level \U0001f44c Chancey ila pic.twitter.com/f307TqIE3X
— Kirubakaran Rajendran (@kirubaakaran) November 12, 2020


More from Trading


You May Also Like


Keep dwelling on this:
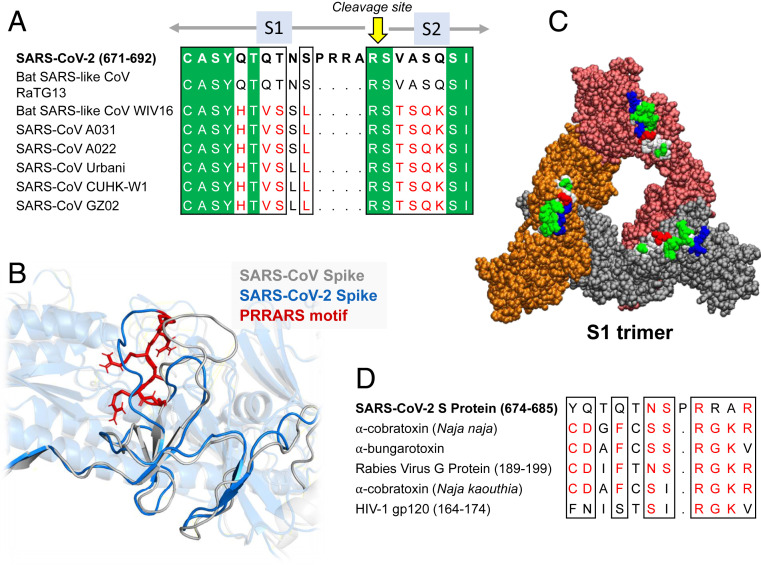
Further Examination of the Motif near PRRA Reveals Close Structural Similarity to the SEB Superantigen as well as Sequence Similarities to Neurotoxins and a Viral SAg.
The insertion PRRA together with 7 sequentially preceding residues & succeeding R685 (conserved in β-CoVs) form a motif, Y674QTQTNSPRRAR685, homologous to those of neurotoxins from Ophiophagus (cobra) and Bungarus genera, as well as neurotoxin-like regions from three RABV strains
(20) (Fig. 2D). We further noticed that the same segment bears close similarity to the HIV-1 glycoprotein gp120 SAg motif F164 to V174.
https://t.co/EwwJOSa8RK
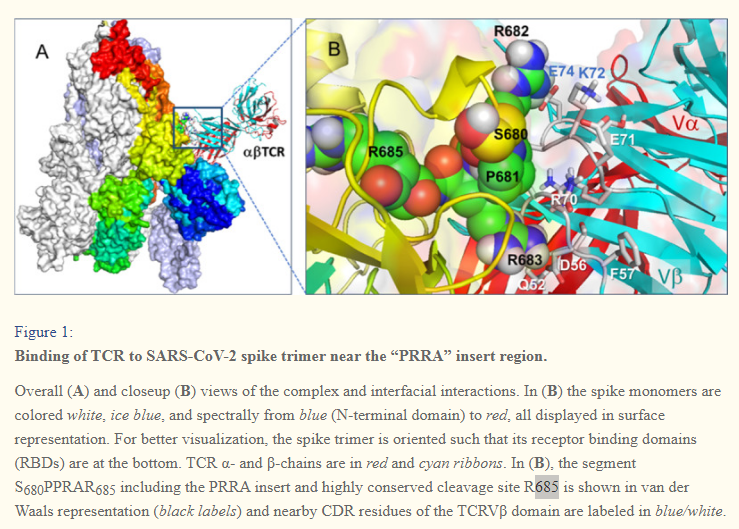
In (B), the segment S680PPRAR685 including the PRRA insert and highly conserved cleavage site *R685* is shown in van der Waals representation (black labels) and nearby CDR residues of the TCRVβ domain are labeled in blue/white
https://t.co/BsY8BAIzDa
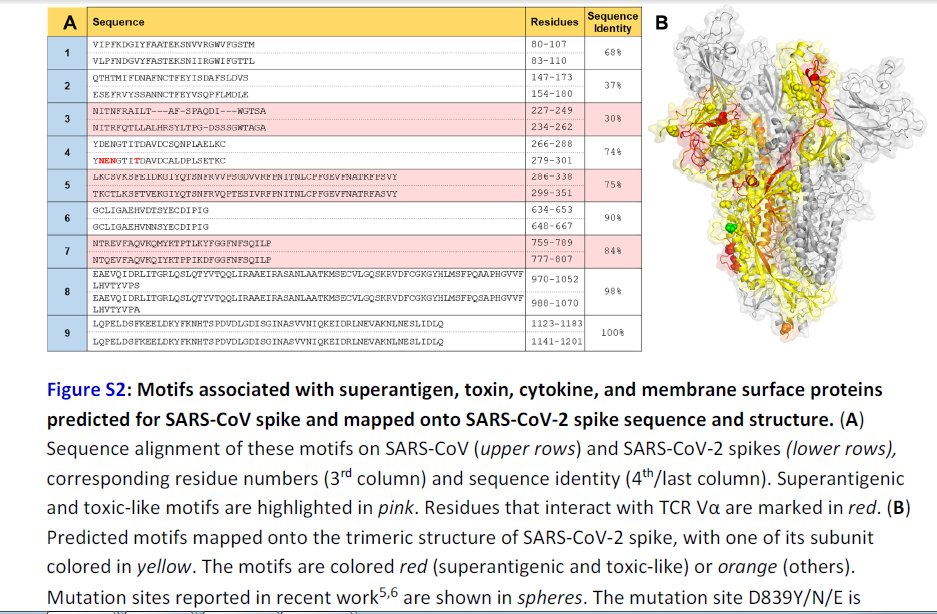
Sequence Identity %
https://t.co/BsY8BAIzDa
Y674 - QTQTNSPRRA - R685
Similar to neurotoxins from Ophiophagus (cobra) & Bungarus genera & neurotoxin-like regions from three RABV strains
T678 - NSPRRA- R685
Superantigenic core, consistently aligned against bacterial or viral SAgs
Further Examination of the Motif near PRRA Reveals Close Structural Similarity to the SEB Superantigen as well as Sequence Similarities to Neurotoxins and a Viral SAg.
The insertion PRRA together with 7 sequentially preceding residues & succeeding R685 (conserved in β-CoVs) form a motif, Y674QTQTNSPRRAR685, homologous to those of neurotoxins from Ophiophagus (cobra) and Bungarus genera, as well as neurotoxin-like regions from three RABV strains
(20) (Fig. 2D). We further noticed that the same segment bears close similarity to the HIV-1 glycoprotein gp120 SAg motif F164 to V174.
https://t.co/EwwJOSa8RK
In (B), the segment S680PPRAR685 including the PRRA insert and highly conserved cleavage site *R685* is shown in van der Waals representation (black labels) and nearby CDR residues of the TCRVβ domain are labeled in blue/white
https://t.co/BsY8BAIzDa
Sequence Identity %
https://t.co/BsY8BAIzDa
Y674 - QTQTNSPRRA - R685
Similar to neurotoxins from Ophiophagus (cobra) & Bungarus genera & neurotoxin-like regions from three RABV strains
T678 - NSPRRA- R685
Superantigenic core, consistently aligned against bacterial or viral SAgs