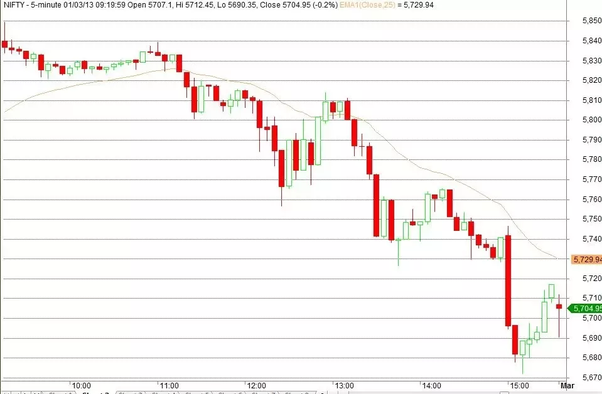
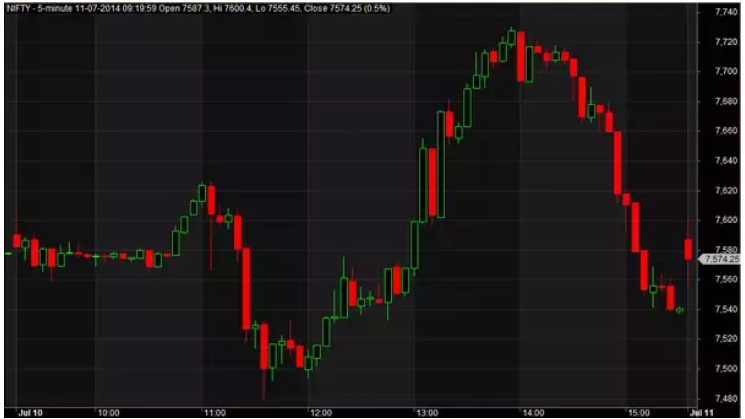
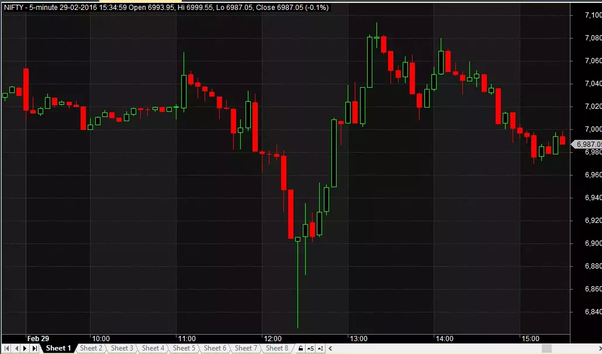
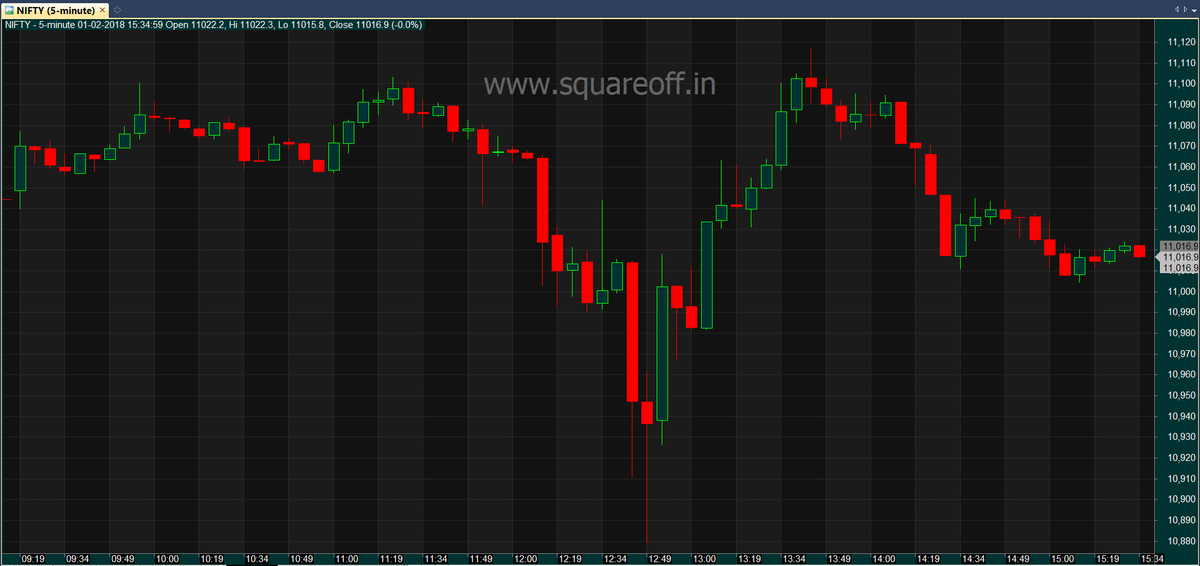
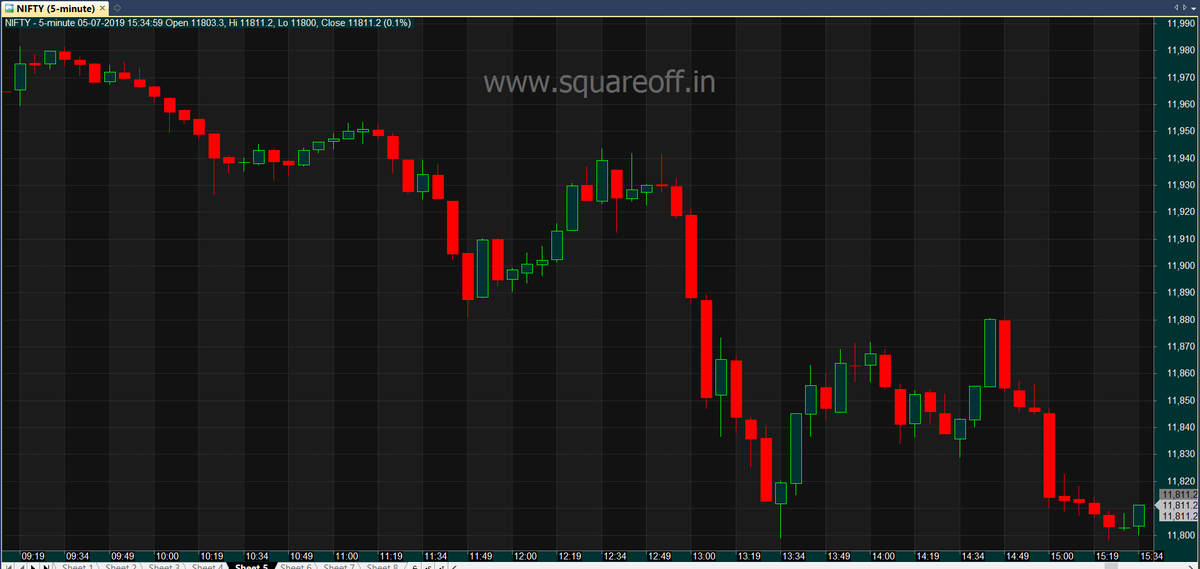
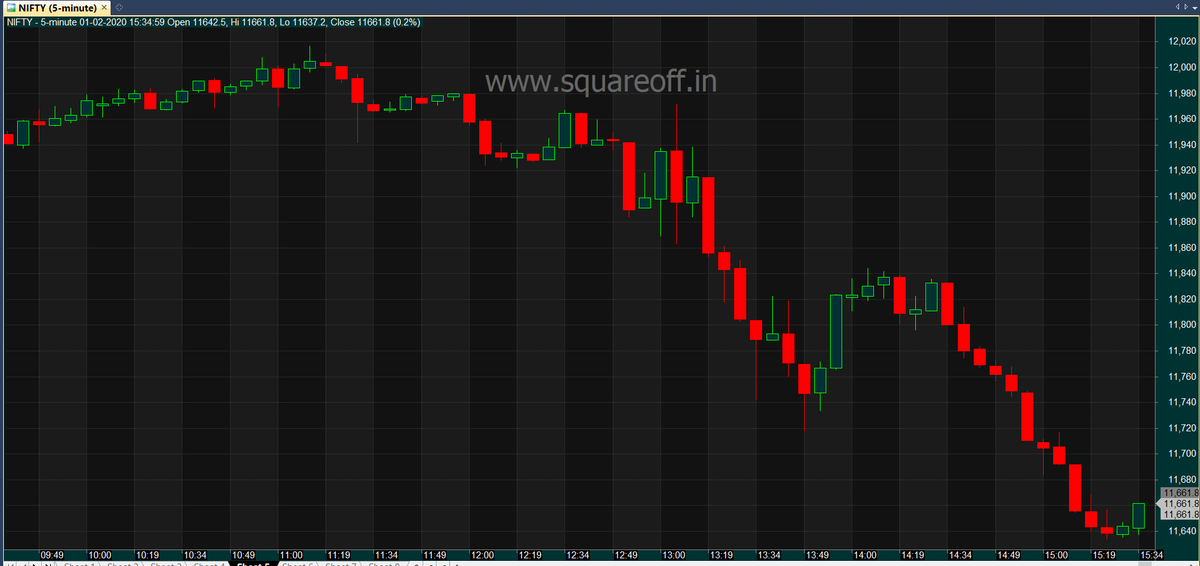
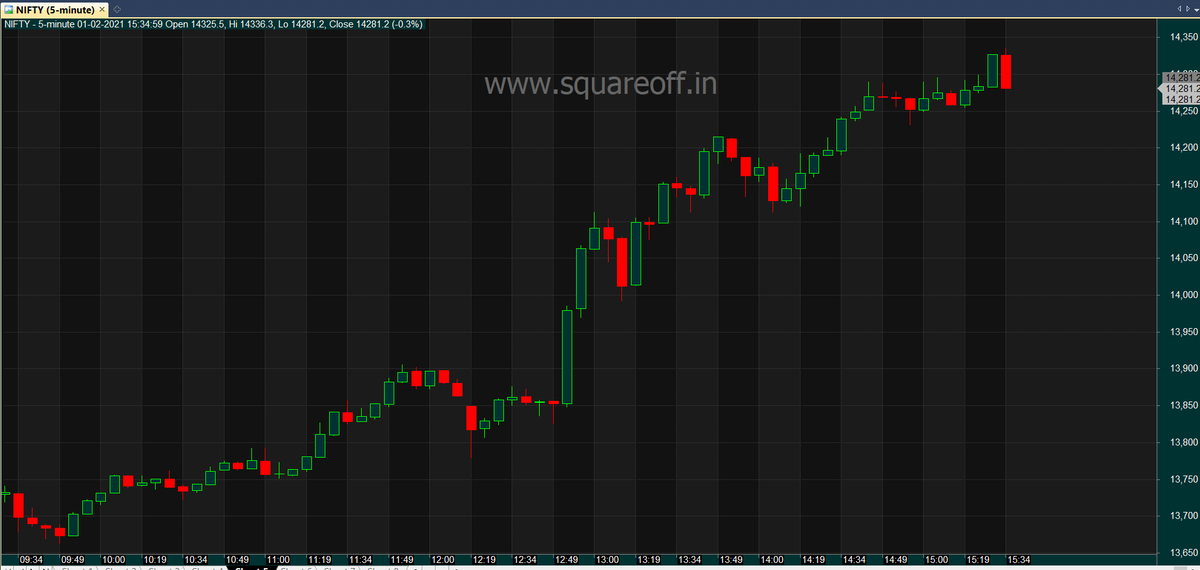
Here's the last 13 years of #BudgetSession Intraday chart, lets figure out what kind of Trading strategy one can use to make use of Budget movement. This is what happened with #Nifty on intraday time frame on the budget day from year 2008 to 2021.


More from Kirubakaran Rajendran
Here's a detailed analysis of 920 Straddle with 25% SL using @stockmock_in platform. This analysis would show which days are max profitable, how it behaves on gap days and how it behaves on different VIX days. 🧵
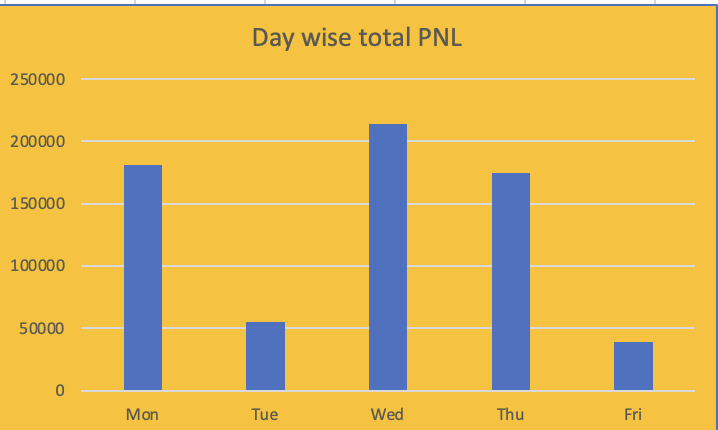
Here's day wise total profits, Wednesday are the days it has generated highest profits compared to all other days and Friday being the least profitable day.
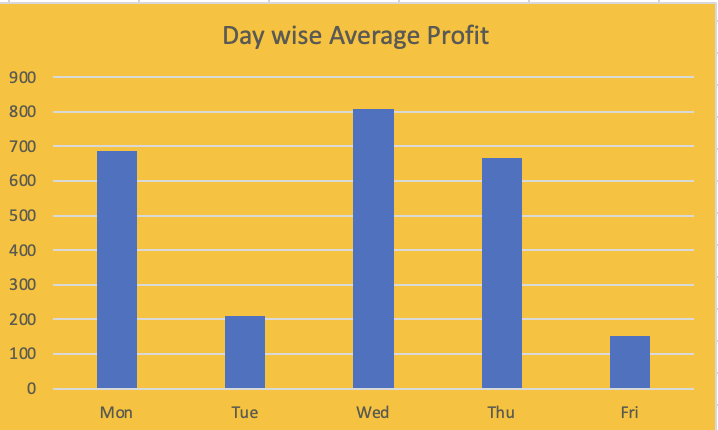
Here's day wise average profits, obviously Wednesday are the days it has generated highest average profits compared to all other days and Friday being the least profitable day.
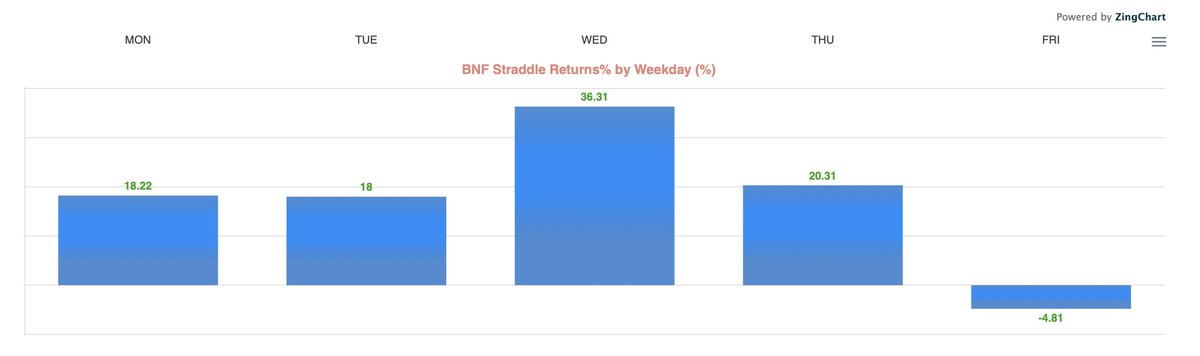
Even the live profits after all charges generated through 920 straddle trading bots at https://t.co/AKj4vqky6X also reflected Fridays are not profitable when you incur all charges. Wednesday being the most profitable day. Live profits are shown here https://t.co/3hgti23lRB
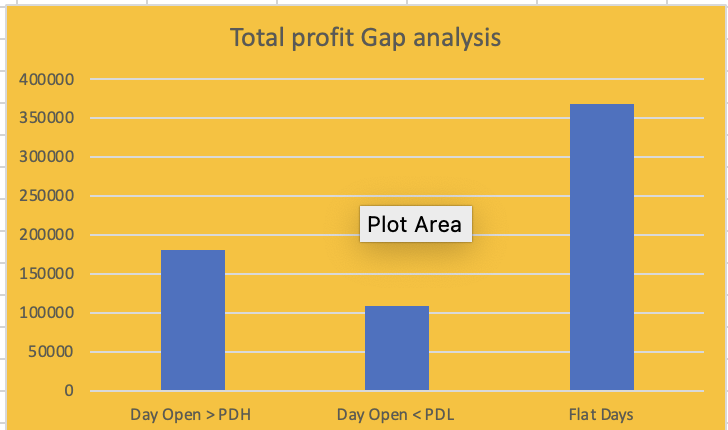
Here's total profits made during gaps, when day open is greater than previous day high, Day open < Prev day low and flat days. Irrespective of gaps, its able to generate profits over all. Even the avg profits denotes the same
Here's day wise total profits, Wednesday are the days it has generated highest profits compared to all other days and Friday being the least profitable day.
Here's day wise average profits, obviously Wednesday are the days it has generated highest average profits compared to all other days and Friday being the least profitable day.
Even the live profits after all charges generated through 920 straddle trading bots at https://t.co/AKj4vqky6X also reflected Fridays are not profitable when you incur all charges. Wednesday being the most profitable day. Live profits are shown here https://t.co/3hgti23lRB
Here's total profits made during gaps, when day open is greater than previous day high, Day open < Prev day low and flat days. Irrespective of gaps, its able to generate profits over all. Even the avg profits denotes the same
Most beginners when building a trading strategy simply use current info and test with it, they don't know How to Get Historical Stock Futures lot size, list of stocks that are part of index like Nifty 50, Nifty 500 historically, I will share all such info in this thread
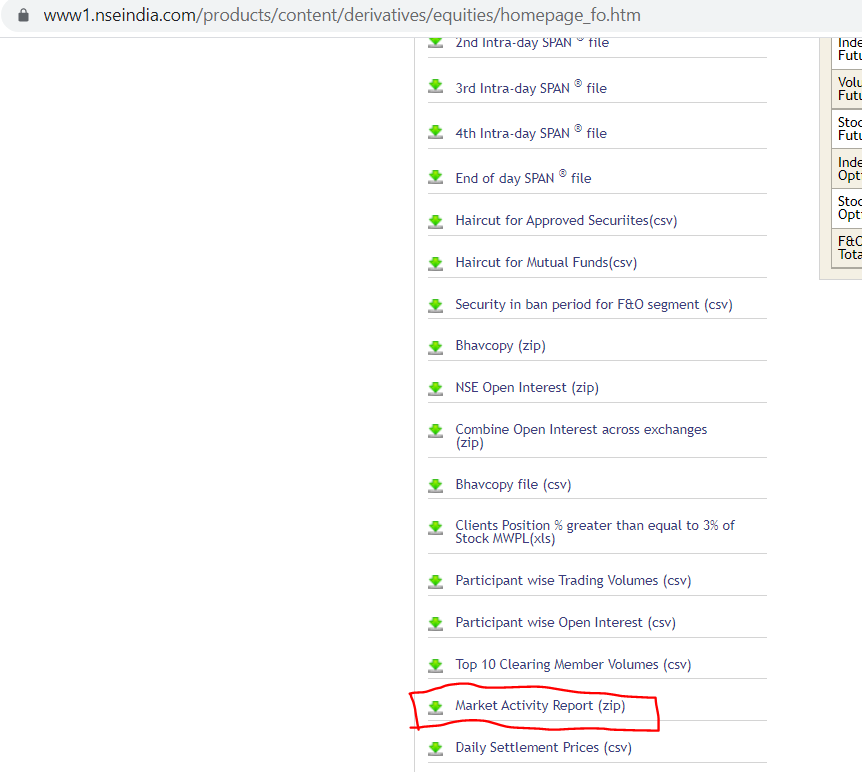
Please note that there is no way to get the historical lot size of stocks futures, NSE don't publish it directly, so we need to do some calculated steps to get that data. Download Market Activity report https://t.co/HKLkSVtXEI
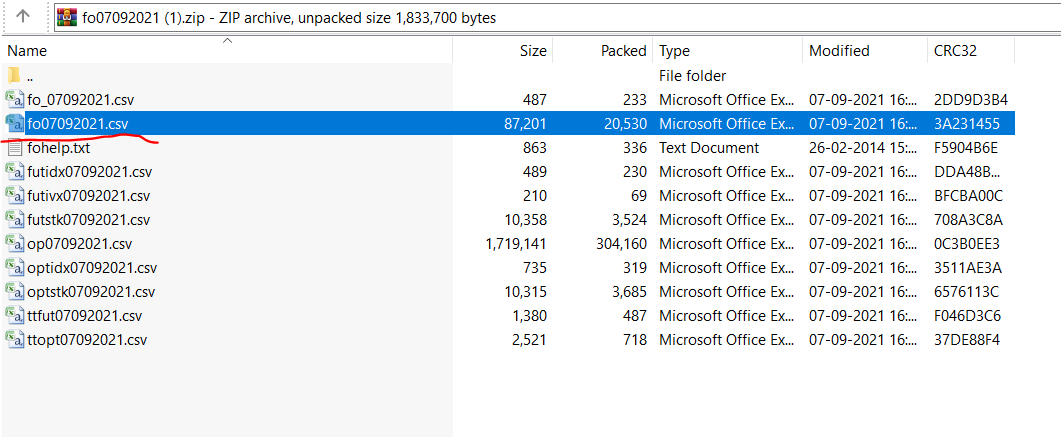
The zip file contains multiple files, open the second file.
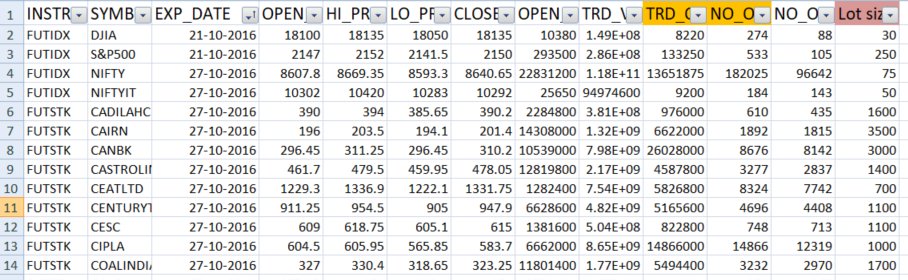
The file will contain stock symbol, expiry date, OHLC data, along with that you get traded quantity and No of contracts traded, using this data we can calculate the lot size of every stock symbol. Simply divide Traded QTY / NO of contracts gives you the lot size.
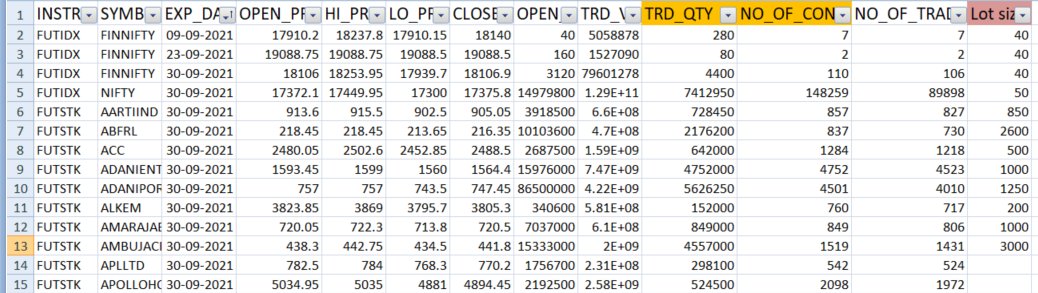
So to get the historical stock futures data, all you need to do is change the date in the below link
https://t.co/xIBXsPpIVt For an example, to get the historical stock futures lot size data for Sep 2016, use https://t.co/Criu7S3Fi5
Please note that there is no way to get the historical lot size of stocks futures, NSE don't publish it directly, so we need to do some calculated steps to get that data. Download Market Activity report https://t.co/HKLkSVtXEI
The zip file contains multiple files, open the second file.
The file will contain stock symbol, expiry date, OHLC data, along with that you get traded quantity and No of contracts traded, using this data we can calculate the lot size of every stock symbol. Simply divide Traded QTY / NO of contracts gives you the lot size.
So to get the historical stock futures data, all you need to do is change the date in the below link
https://t.co/xIBXsPpIVt For an example, to get the historical stock futures lot size data for Sep 2016, use https://t.co/Criu7S3Fi5
I have been watching movies from a very early age and I just love it. Watching a good movie makes you forget that you are actually watching a movie. Here's a master thread about reviews of all the movies I have shared in twitter so far.Trying to find a weekend movie? Here it is

https://t.co/gjTHTKyyb2
https://t.co/ZCNxllFLB0
https://t.co/uqlAlXdFga
https://t.co/wMf9Q0G6uY
https://t.co/gjTHTKyyb2
It Ain\u2019t What You Don\u2019t Know That Gets You Into Trouble. It\u2019s What You Know for Sure That Just Ain\u2019t So. Watching #TheBigShort
— Kirubakaran Rajendran (@kirubaakaran) March 14, 2020
Perfect movie for this weekend in current market scenario. pic.twitter.com/OuW1ERAztx
https://t.co/ZCNxllFLB0
When U think of Cars, if #FastAndFurious what comes to your mind, then this movie is not for you. Instead if #Rush movie comes to your mind, then definitely #FordVsFerrai is for you. What an amazing movie, Matt & Bale performance was top notch. Must watch movie. pic.twitter.com/KTGAEhLu9V
— Kirubakaran Rajendran (@kirubaakaran) November 19, 2019
https://t.co/uqlAlXdFga
If you haven\u2019t watched this movie, check it out. The China Hustle. Fantastic documentary that covers about how bogus Chinese firms made millions with IPO, how they tackled these satellite tracking. https://t.co/nC3MTxFpZo pic.twitter.com/3iuhFpOA45
— Kirubakaran Rajendran (@kirubaakaran) April 3, 2020
https://t.co/wMf9Q0G6uY
#SooraraiPottru Entrepreneurship is living a few years of your life like most people won\u2019t, so that you can spend the rest of your life like most people can\u2019t.\u201d No business is inferior to one another. Most inspiring Tamil movie in recent times, Vera level \U0001f44c Chancey ila pic.twitter.com/f307TqIE3X
— Kirubakaran Rajendran (@kirubaakaran) November 12, 2020