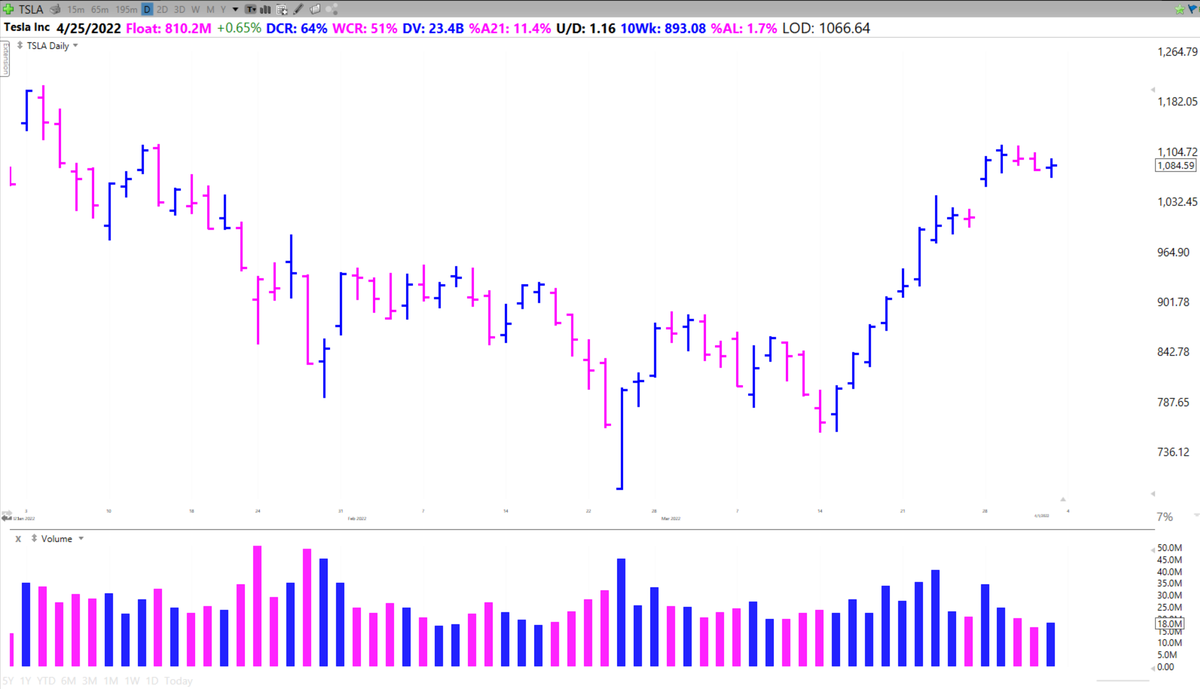
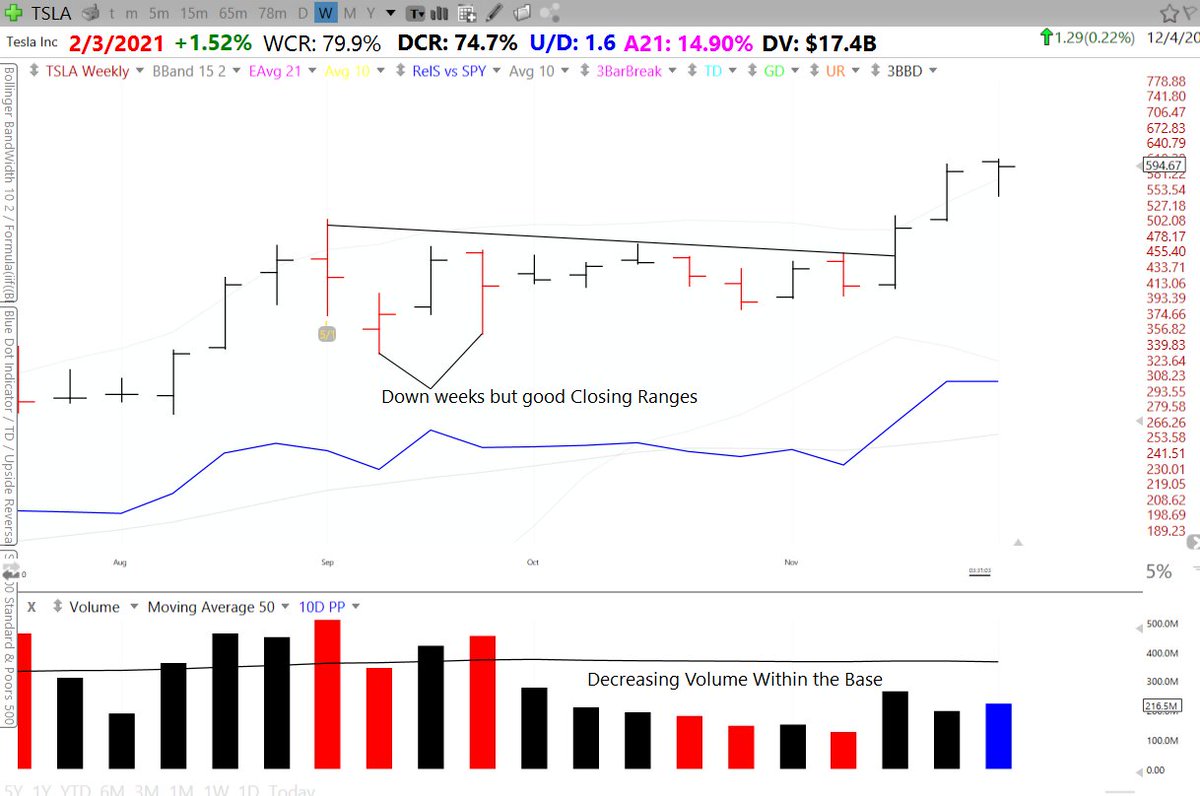
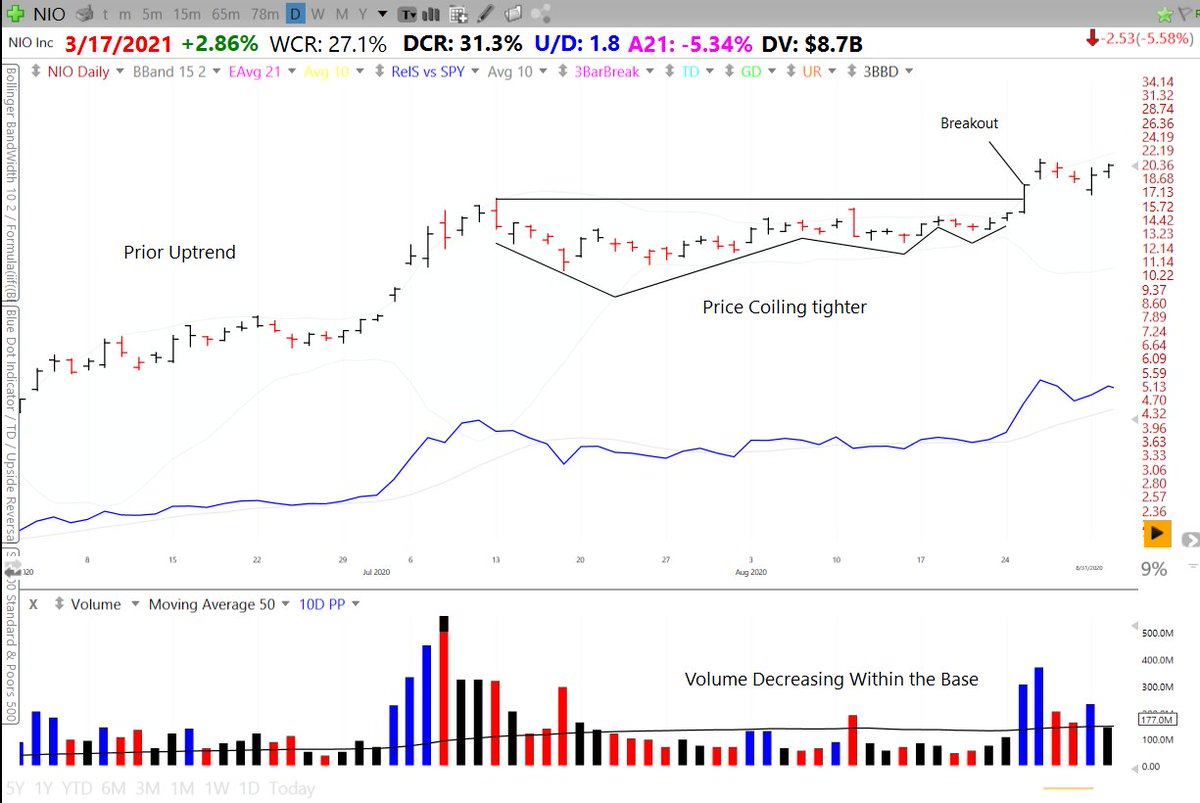
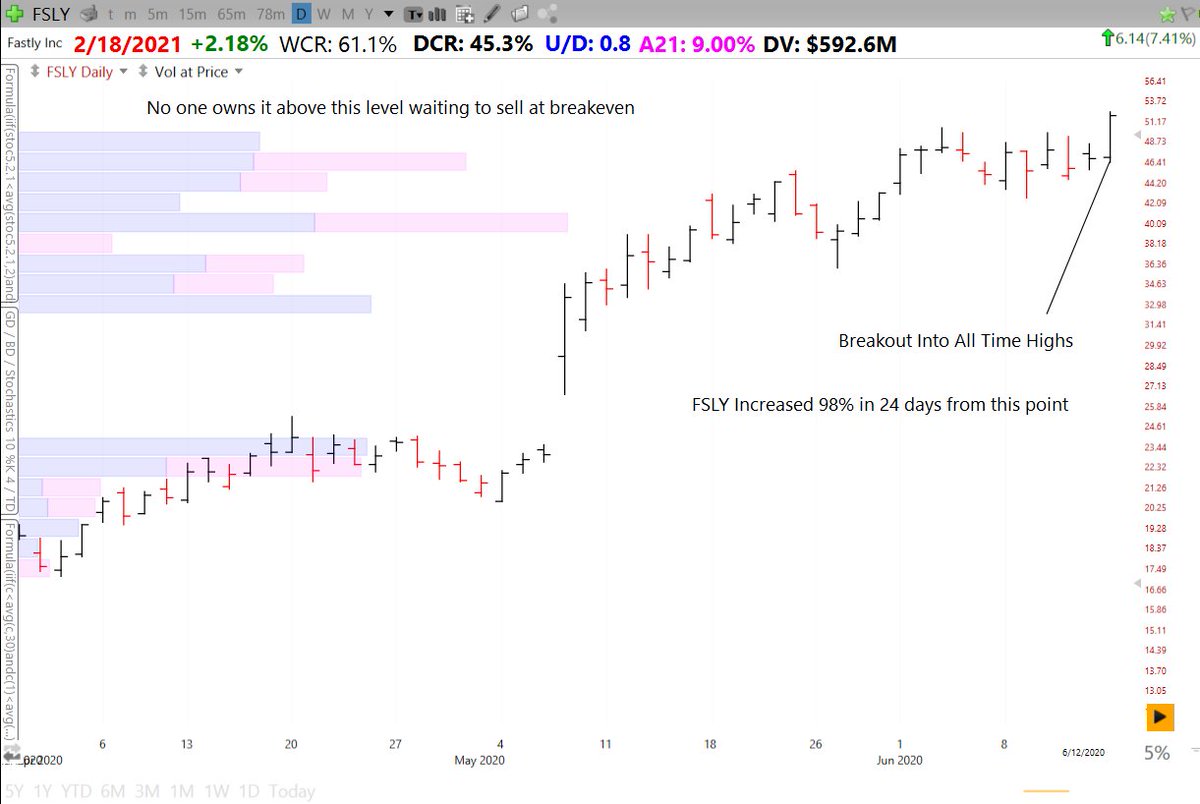
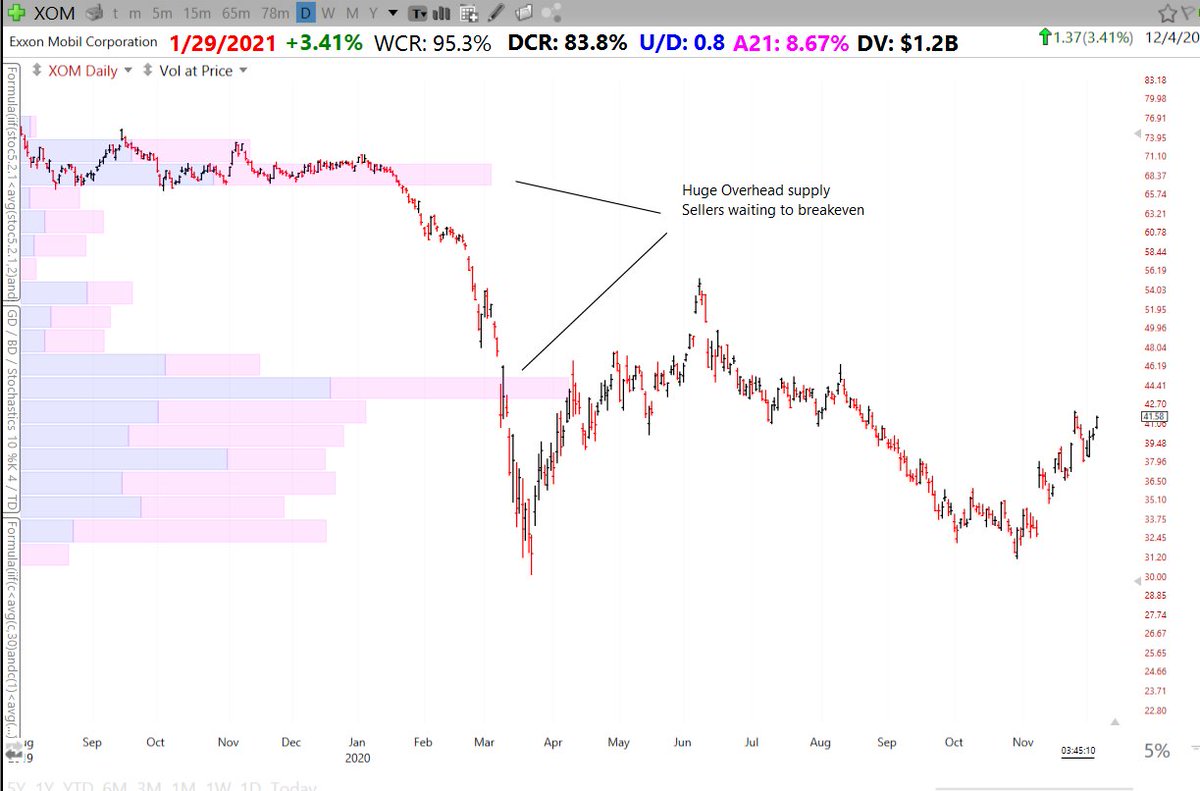
An Introduction to Price and Volume Action (thread)


https://t.co/KGT7xQA9nS
Thread of Threads
— Richard Moglen \U0001f4fd\ufe0f\U0001f981\U0001f6a2 (@RichardMoglen) August 30, 2020
First, a little about mehttps://t.co/FnP1oR3rf7
More from Richard Moglen 📽️🦁🚢
What is a True Market Leader / TML (Thread)
(And how to find them)
In one sentence a TML is an institutional quality stock in a leading industry group with superior fundamentals and technicals
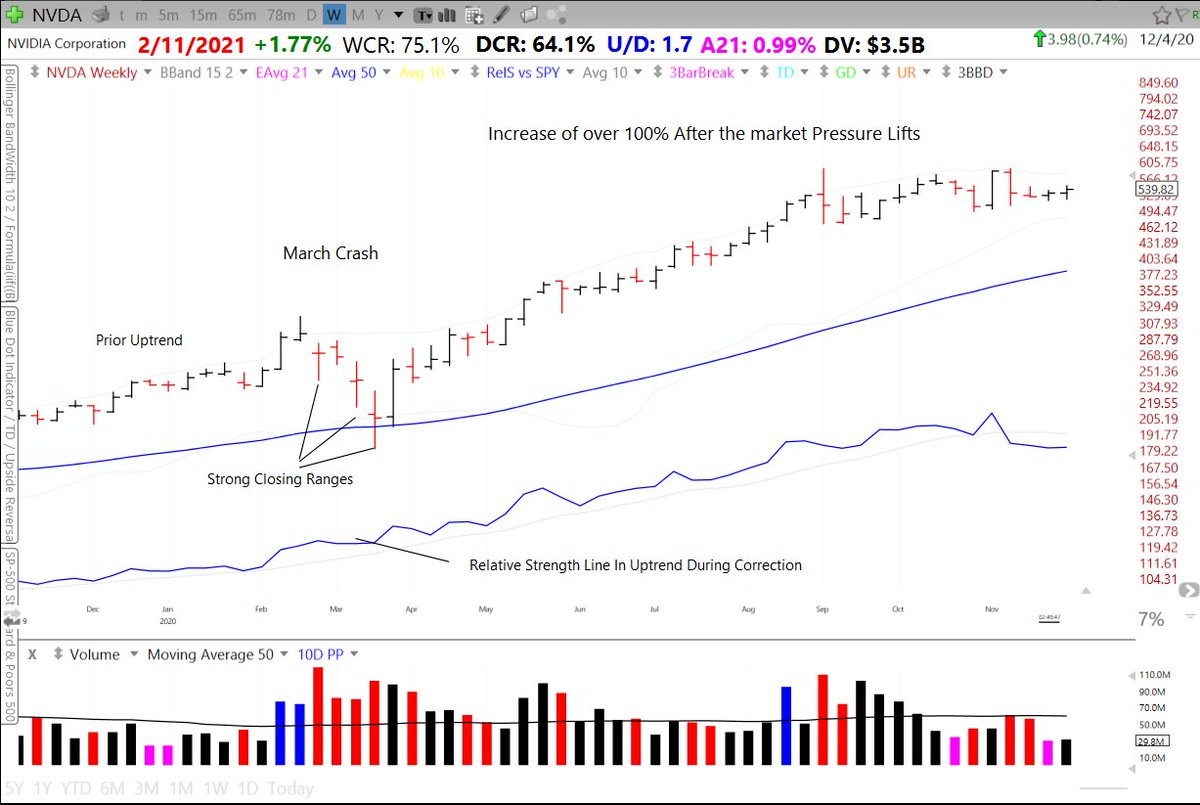
These are monster stocks which over the course of weeks and months increase +100% to +5,000%
TMLs are popular with traders/investors whose methodology is based on the CANSLIM system developed by William O'Neil.
He called them Model Book Stocks. Huge winners worth studying to identify common characteristics that they all share
O'Neil studied over 1000 model book stocks going back to the 1880s.
Many are shown and discussed in these must read books
How To Make Money in Stocks, O"Neil
https://t.co/S2sShZedUm
Monster Stocks, John Boik @monsterstocks1
A Few Examples courtesy of @SystematiCK_
Pic N Save
(And how to find them)
In one sentence a TML is an institutional quality stock in a leading industry group with superior fundamentals and technicals
These are monster stocks which over the course of weeks and months increase +100% to +5,000%
TMLs are popular with traders/investors whose methodology is based on the CANSLIM system developed by William O'Neil.
He called them Model Book Stocks. Huge winners worth studying to identify common characteristics that they all share
O'Neil studied over 1000 model book stocks going back to the 1880s.
Many are shown and discussed in these must read books
How To Make Money in Stocks, O"Neil
https://t.co/S2sShZedUm
Monster Stocks, John Boik @monsterstocks1
A Few Examples courtesy of @SystematiCK_
Pic N Save
#Study & #learn from past super #stocks
— SystematiCK Trader (@SystematiCK_) September 26, 2020
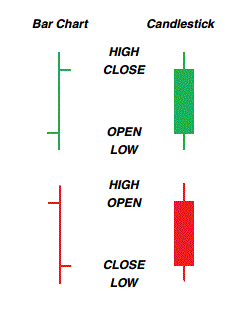
Example 22: Pic N Save - 1979
Sharpen your eyes & internalize
- which fundamental and technical setup fuelled the big gain
- how trade management was done
- the importance of acc./distr. volume
Credit to the great W. O\u2019Neil! pic.twitter.com/m888ZaGyMV
How to time the market (thread)
There is the old saying that “Time in the market beats timing the market” The chart below from Dr. Wish’s @WishingWealth presentation at the @TraderLion_ conference shows that to be false.
Full presentation: https://t.co/o2f21GBXci
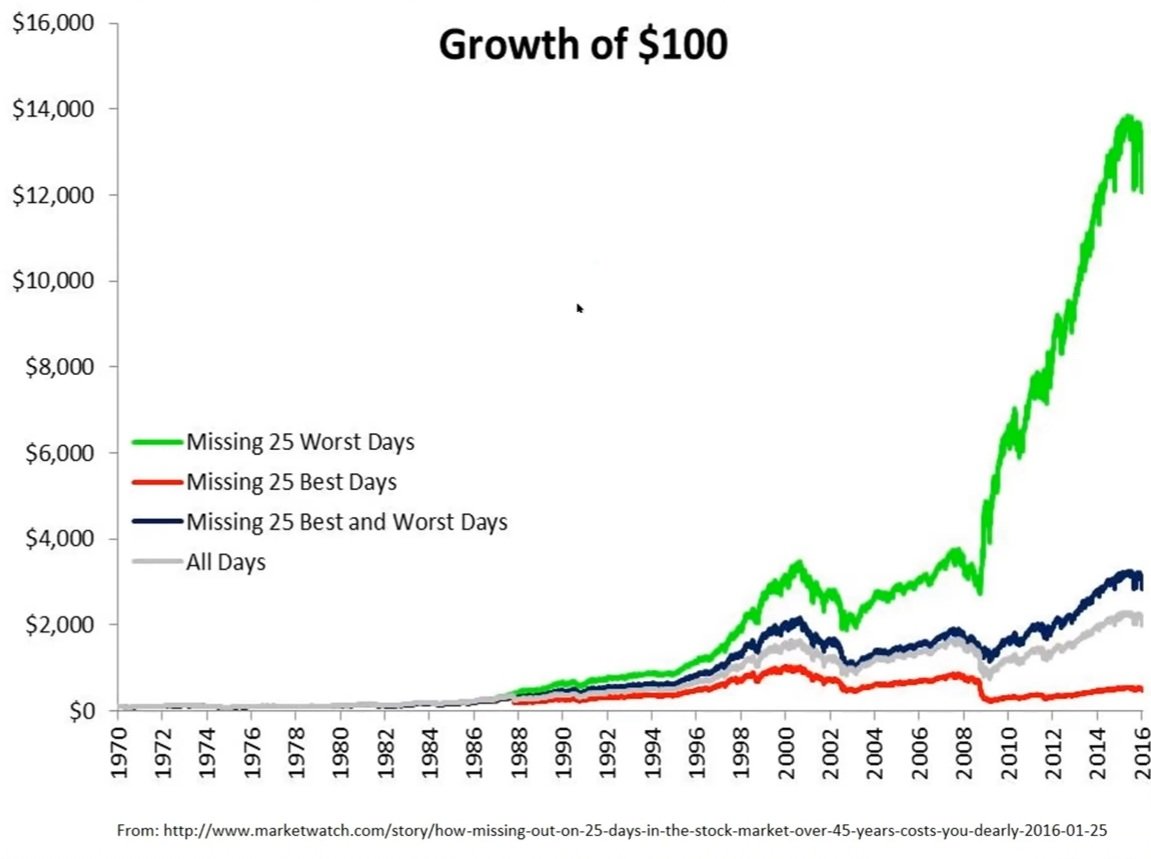
The green line is unattainable realistically, however, missing volatile times during corrections yields better performance than buy and hold and we can aim for the green line.
Investors usually only show the gray and red results.
More
There are many strategies for investing/trading in the stock market operating within different timeframes and with different objectives.
That is of course what creates a market and opportunity. Timing the market may not be what works for you or what fits your goals/lifestyle.
However, everyone involved in the market is here to make money over time and corrections can cause huge drawdowns in the high alpha names negating incredible performance during strong market uptrends.
There is the old saying that “Time in the market beats timing the market” The chart below from Dr. Wish’s @WishingWealth presentation at the @TraderLion_ conference shows that to be false.
Full presentation: https://t.co/o2f21GBXci
The green line is unattainable realistically, however, missing volatile times during corrections yields better performance than buy and hold and we can aim for the green line.
Investors usually only show the gray and red results.
More
There are many strategies for investing/trading in the stock market operating within different timeframes and with different objectives.
That is of course what creates a market and opportunity. Timing the market may not be what works for you or what fits your goals/lifestyle.
However, everyone involved in the market is here to make money over time and corrections can cause huge drawdowns in the high alpha names negating incredible performance during strong market uptrends.