By the end of this thread, you will:
✅Be able to identify the main characteristics of a proper base
✅Understand subtle clues of accumulation
✅Have access to 20+ real world examples
Let's get started! 👇
Proper bases all have the following characteristics:
▪️ Shallow Base Depths
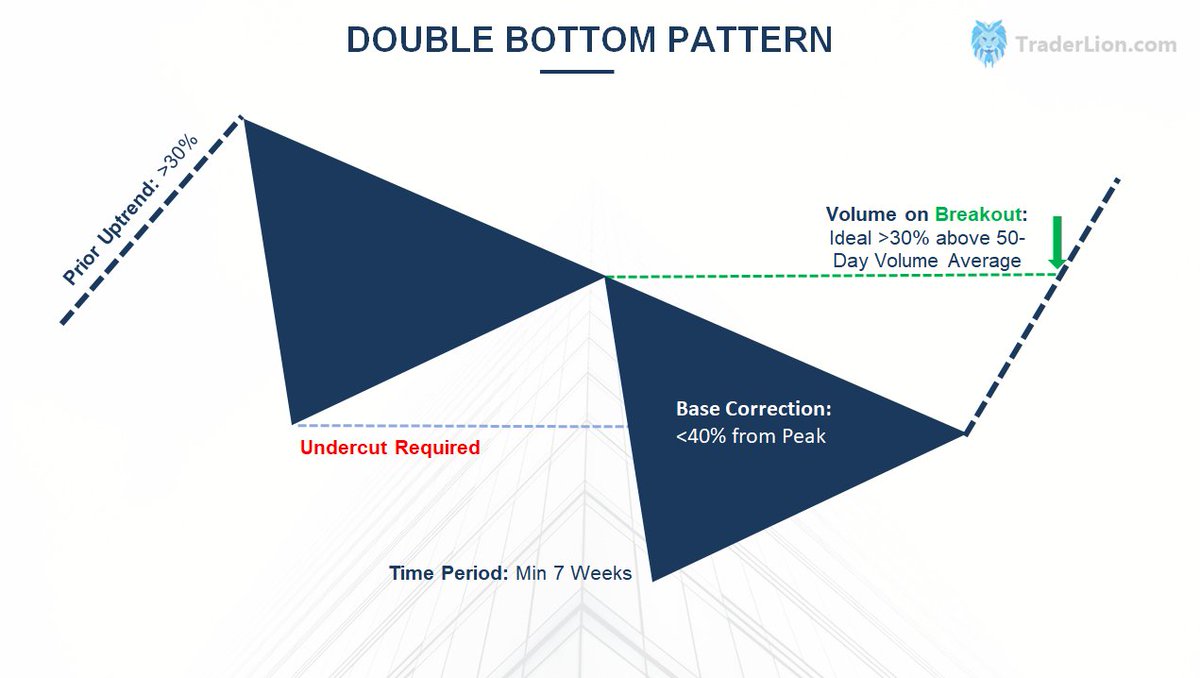
▪️ Prior Uptrend of at least 20%
▪️ Early Stage Base
▪️ Daily & Weekly Accumulation Signatures
▪️ Relative Strength Periods
Follow along as we break down each aspect in greater detail below 👍
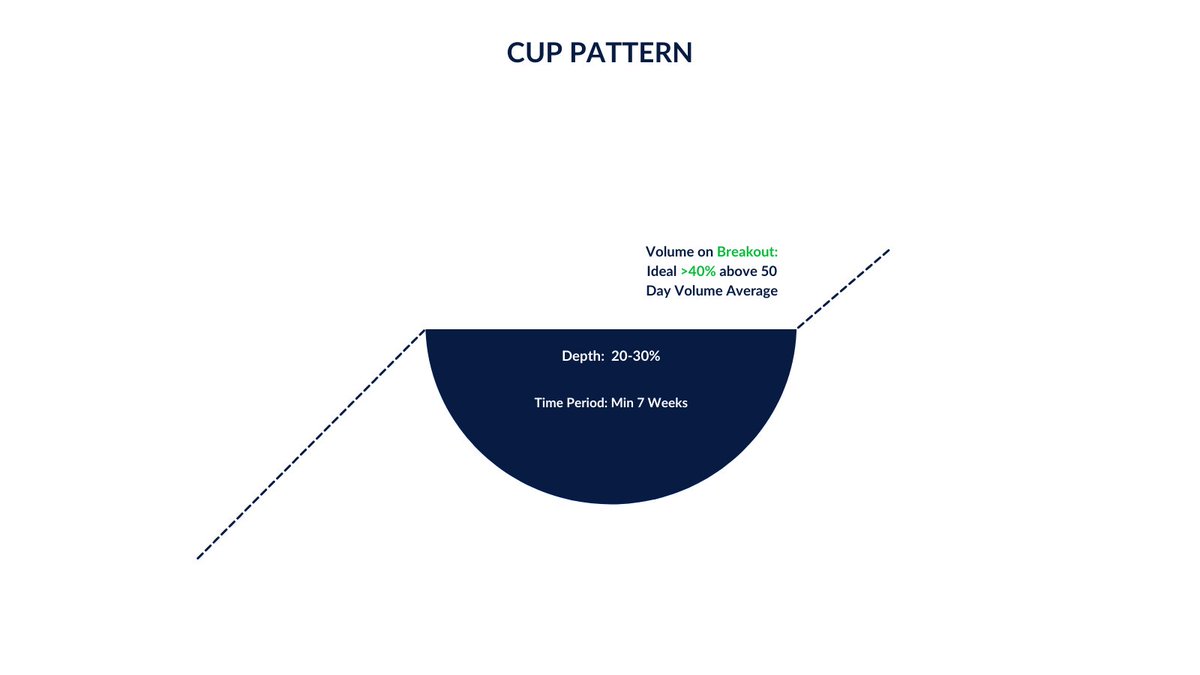
#1: Shallow Base Depths
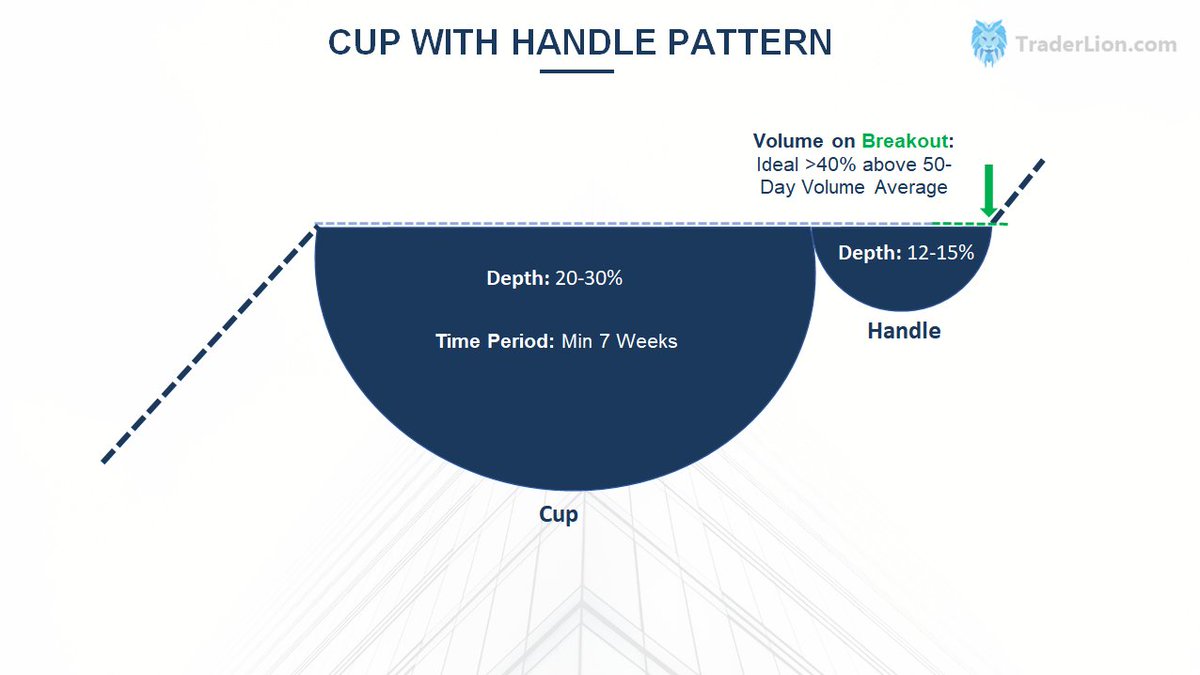
Base depth is a key component of a proper base.
We measure a base's depth from the absolute peak to the absolute low.
Institutions are the major base builders in the market, & the shallower the base, the stronger the institutional hold in the name.
Here are some good criteria to keep in mind when analyzing bases:
< 20-30% off the highs = best
< 30-40% off the highs = good
< 40-50% off the highs = acceptable under certain circumstances
> 50%+ off the highs = avoid (with exception to some younger IPO names)
Important base depth nuances
Base depth will always be at least somewhat dependent on the general market drawdown.
Growth stocks usually overshoot the market by at least 2x to the upside AND downside.
We also want to pay attention to Relative Strength (more on that later)
If the general market is down 20% off highs, growth stocks may all be around 40% off highs.
A good rule of thumb is to check base depths that are less than 2x the average market drawdown.
These will likely be the strongest names in the next uptrend.
Real world examples:
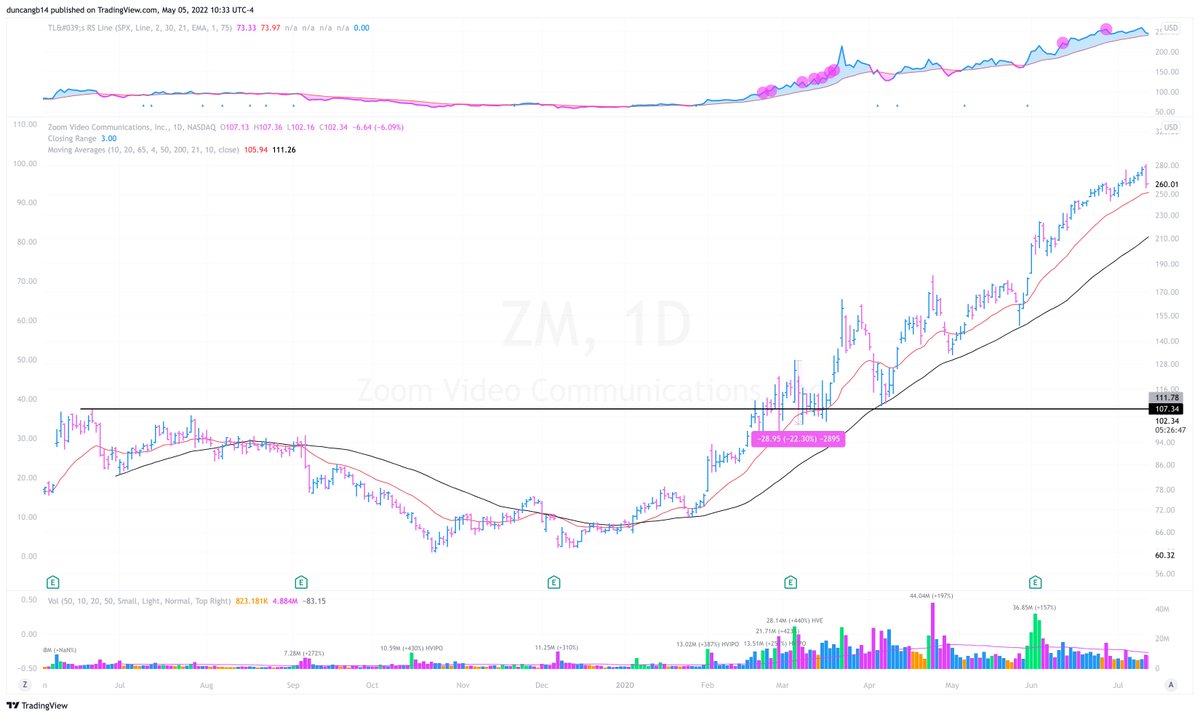
From February 19, 2020 to March 23, 2020, the QQQ drew down 30.55%.
When analyzing base depths of potential leaders, we should be looking for names that are down less than 2.5x that mark.
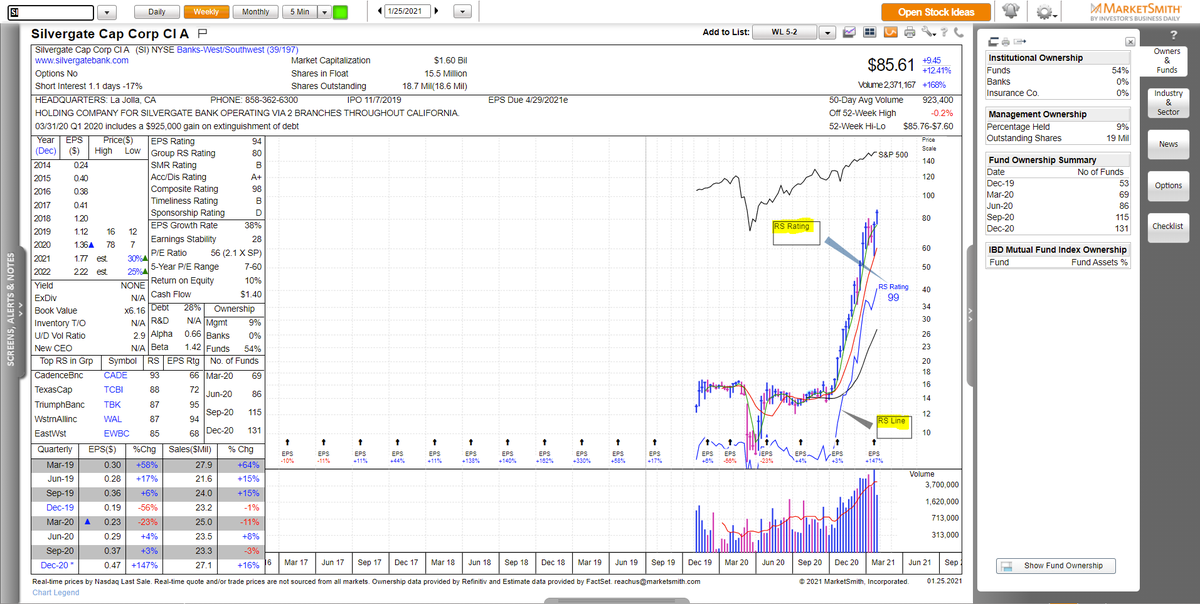
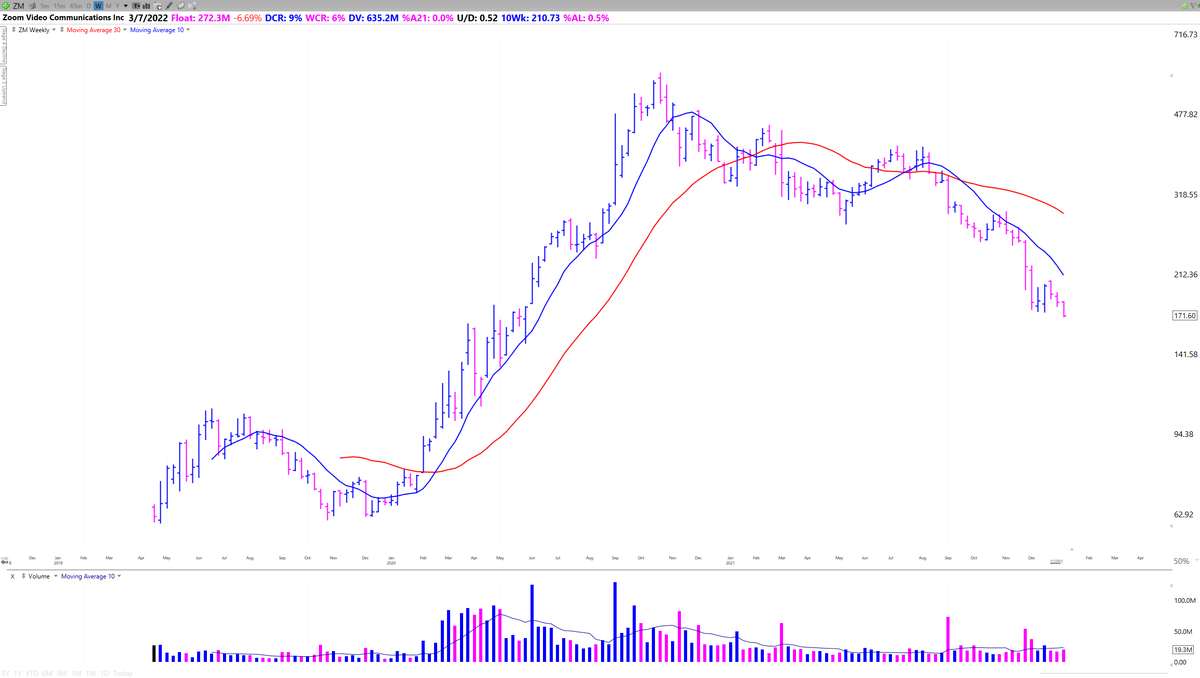
Potential Leaders As a Result:
$ZM - base depth of 22.30%
$AMZN - base depth of 25.61%
$DOCU - base depth of 29.9%
$FVRR - base depth of 41.87%
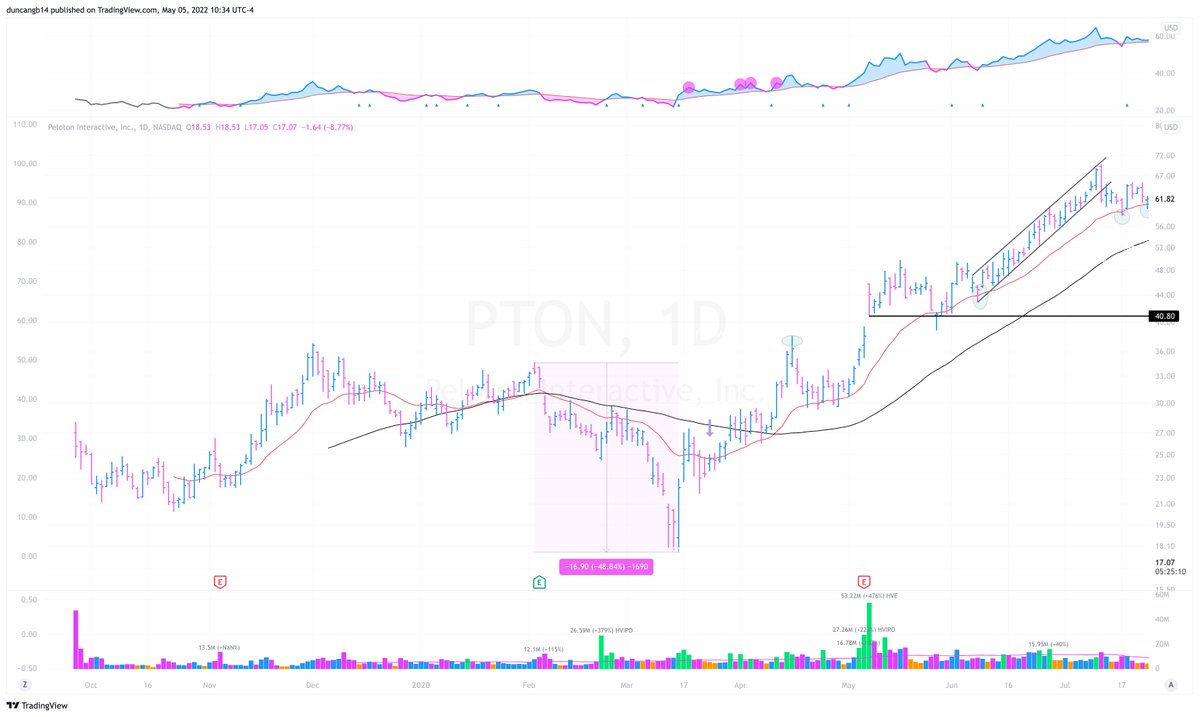
Some other notable names w/ steeper base depths but within the 2x general market drawdown range:
$PTON - base depth of 48.84%
$ETSY - base depth of 52.64%
$CRWD - base depth of 52.71%
$TSLA - base depth of 63.83%
Here's
@RossHaber_ and
@richardmoglen covering 4 model book stocks from 2020
https://t.co/EM2lHuQhpr Let's keep going...
@RossHaber_ @RichardMoglen #2: Prior Uptrends of at Least 20%
Winning stocks continue to win. That is why the best bases have a prior uptrend of AT LEAST 20%.
This tells us that institutional accumulation was going on as price was increasing.
The bigger the prior increase, the better.
@RossHaber_ @RichardMoglen We want to focus on stocks that are already in uptrends, above longer term moving averages such as the 200 SMA.
Proper Bases form just after a stock has shown power and the potential to produce a significant trend.
@RossHaber_ @RichardMoglen William O'Neil's famous chart pattern, the High Tight Flag (HTF) is a perfect example of this.
The stronger the prior uptrend, the stronger the potential move afterwards.
Here's a thread we put together if you're looking for more on the HTF setup 👇
https://t.co/pLv4axeCMT
@RossHaber_ @RichardMoglen #3: Early Stage Bases
Counting base stages was yet another concept created by William O'Neil.
The idea is that a stock that goes on a large run will have multiple basing periods, and the later the basing periods the higher the likelihood of failure.
@RossHaber_ @RichardMoglen Psychology behind focusing on early stage bases:
✅ Not as obvious to the public
✅ Institutions will be accumulating more shares early in run
✅ Price leads fundamentals
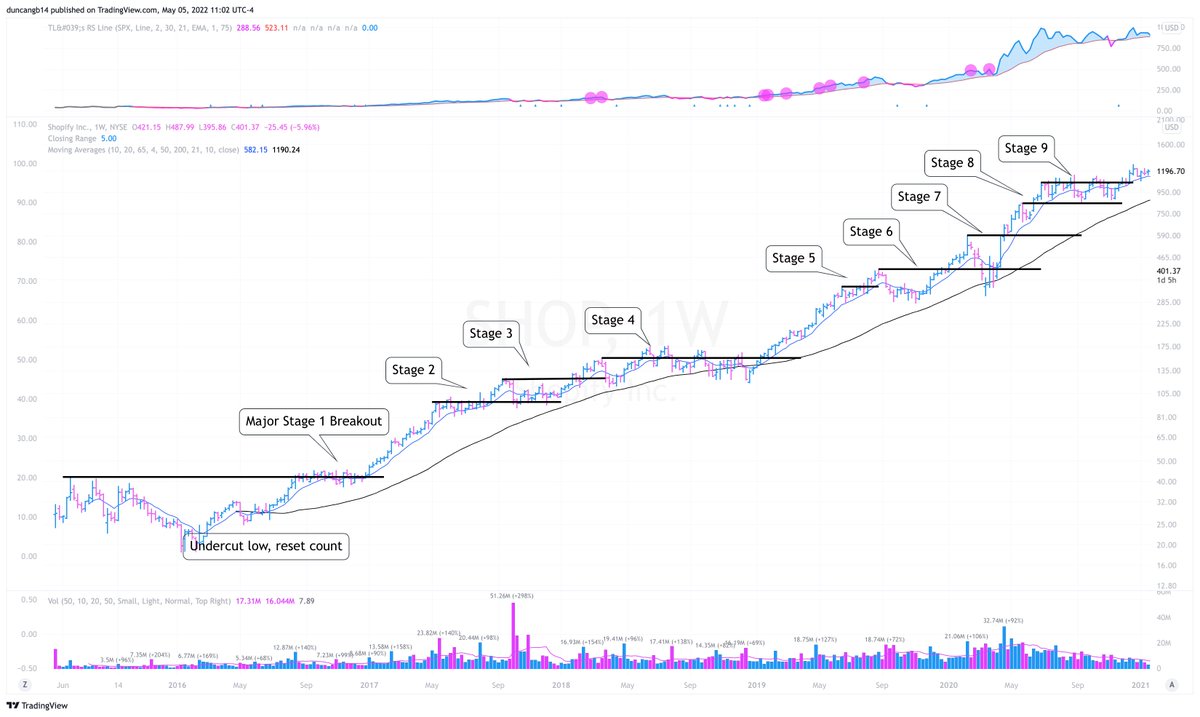
@RossHaber_ @RichardMoglen This is why it is important to focus on stocks that are coming out of Stage 1 to Stage 3 bases.
@RossHaber_ @RichardMoglen It is important to note that some of the biggest winners in the market went on to run over 1000% and had 5+ base stages.
Two examples:
$SHOP (2015-2021)
$CSCO (1990-1994)
This is why it is important to study each base individually with the bigger picture in mind.
@RossHaber_ @RichardMoglen #4: Daily & Weekly Accumulation Signatures
To accurately identify accumulation in a base, we want to start on the weekly chart.
Why?
The longer the timeframe, the more meaningful the accumulation/distribution is.
@RossHaber_ @RichardMoglen William O'Neil taught a very simple technique to quickly determine whether a stock's base was showing enough accumulation for consideration.
@RossHaber_ @RichardMoglen Steps:
1️⃣ Go to the Weekly Chart
2️⃣ Count the # of weeks that showed accumulation (positive price action, strong WCR, & volume above average)
3️⃣ Count the # of weeks that showed distribution (negative price action, poor WCR, & volume above average).
4️⃣ Compare the two numbers!
@RossHaber_ @RichardMoglen The weeks of accumulation must outnumber the weeks of distribution for it to be considered.
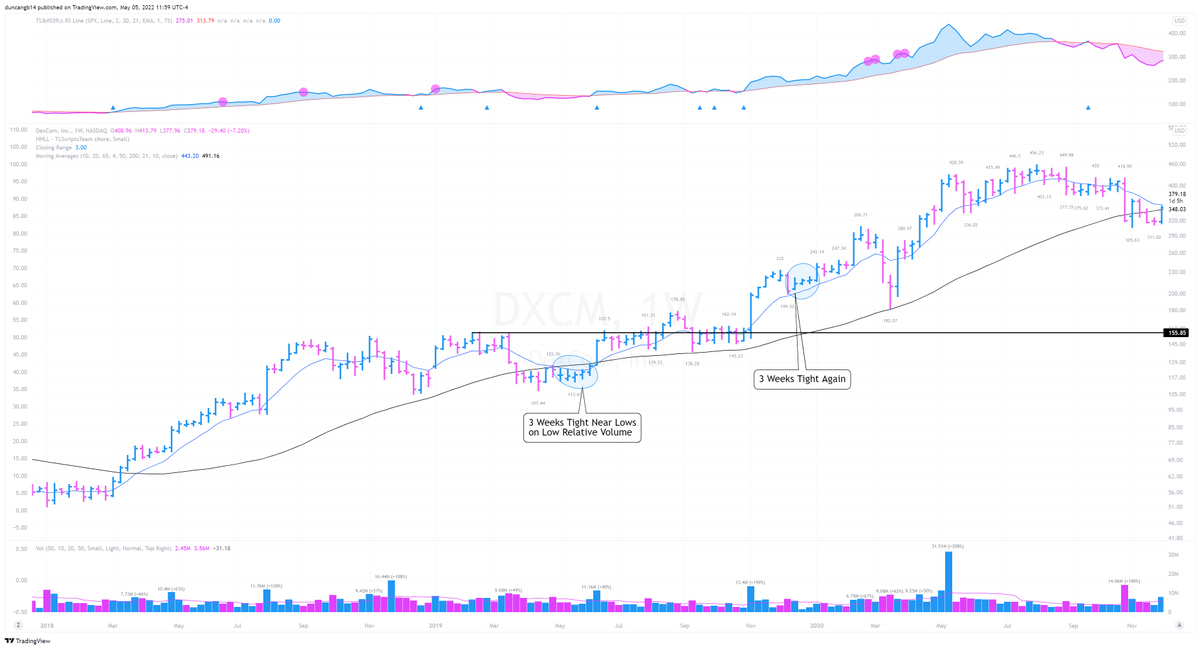
@RossHaber_ @RichardMoglen Another Form of Weekly Accumulation: 3 Weeks Tight Pattern (3WT)
The 3WT Pattern is another sign of subtle accumulation on the weekly timeframe.
We are looking for weekly closes that are within 1.5% of each other.
3WTs tell us institutions are tightly controlling price.
@RossHaber_ @RichardMoglen Examples of 3 Weeks Tight:
$DXCM (2019)
$ROKU (2018-2019)
$SNAP (2020)
@RossHaber_ @RichardMoglen Daily Accumulation Signatures
Much like the weekly chart, and especially up the right side of the base, we want to make sure the strong up days with above average volume occur more often than poor down days with above average volume.
@RossHaber_ @RichardMoglen This tells us that institutions are accumulating on a net basis AS PRICE INCREASES.
@RossHaber_ @RichardMoglen There are also volume accumulation signatures that we look for at TraderLion.
They are the following:
· Highest Volume Ever w/ Earnings Gap Up (HVE)
· Highest Volume In Over a Year w/ Earnings Gap Up (HV1)
· Highest Volume Since IPO Day/Week (HVIPO)
@RossHaber_ @RichardMoglen These traits tell us that a fundamental shift has occurred in the stock, requiring institutions to accumulate shares in an obvious way.
@RossHaber_ @RichardMoglen Some other signs of accumulation:
· Tight price action (ranges that week over week are less than 10%)
Contracting price ranges are a key institutional accumulation characteristic.
The tighter the price action, the stronger the institutional hold and accumulation of the stock.
@RossHaber_ @RichardMoglen Where should this happen?
✅ Before breakouts (under previous resistance points)
✅ During Handles (the higher in the base, the better)
✅ At the lows (shows distribution wearing out)
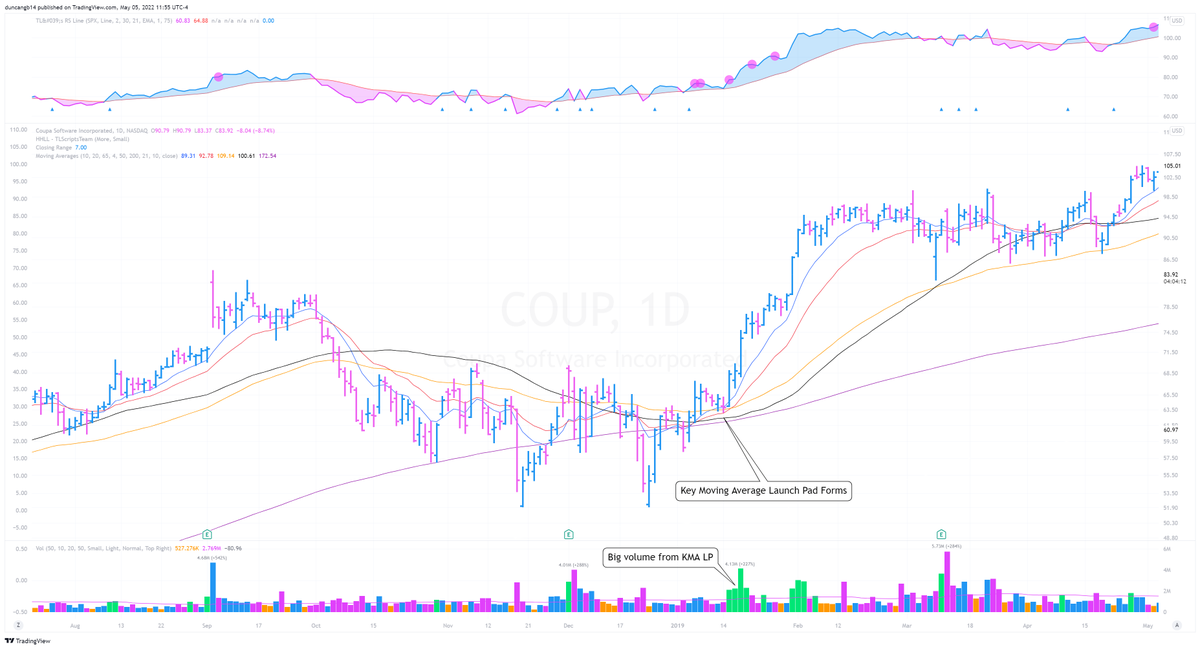
@RossHaber_ @RichardMoglen · Respect for Key Moving Averages (KMAs)
✅ Price respects the 10 Week Moving Average
✅ Price respects the 10DMA, 21EMA, 50DMA, 65EMA, and 200DMA
✅ Launch Pad Setup*
* The Launch Pad Setup occurs when price reclaims important KMAs to the upside on volume.
@RossHaber_ @RichardMoglen More on the Launch Pad Setup:
1️⃣ Price trades underneath the KMAs in a base
2️⃣ Price reclaims these KMAs to the upside
3️⃣ The KMAs start to curl underneath price, forming a Launch Pad for higher prices
4️⃣ Price retests the KMAs & bounces off of them
@RossHaber_ @RichardMoglen Examples:
$COUP (2018)
$SQ (2020)
@RossHaber_ @RichardMoglen We go into much further depth on this topic and many more accumulation characteristics in our Leadership Blueprints course that can be found here 👇
https://t.co/ACSZKEbEud Let's move on to Key Basing Characteristic #5: Relative Strength Periods
@RossHaber_ @RichardMoglen #5: Relative Strength Periods (RS Periods)
All of the best stocks in the market displayed Relative Strength before making their big runs.
RS Periods are the easiest to spot when the market is in a correction.
@RossHaber_ @RichardMoglen Institutions that cannot move to cash have no other choice than to double down on their best ideas.
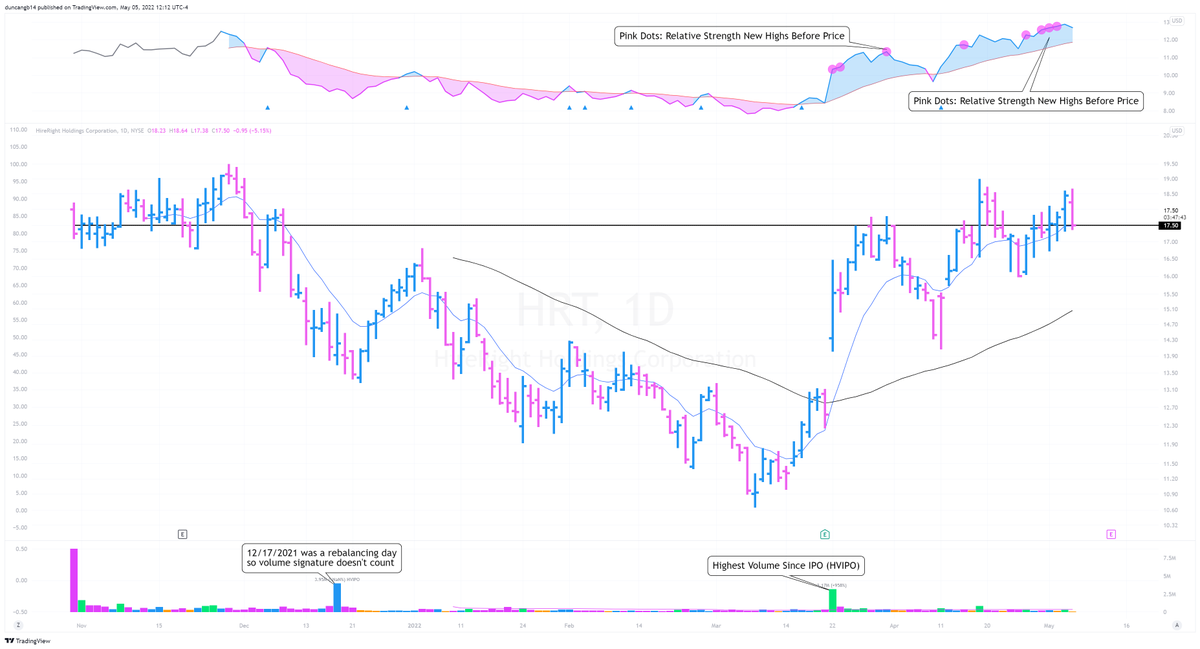
@RossHaber_ @RichardMoglen A Key Characteristics to Look for:
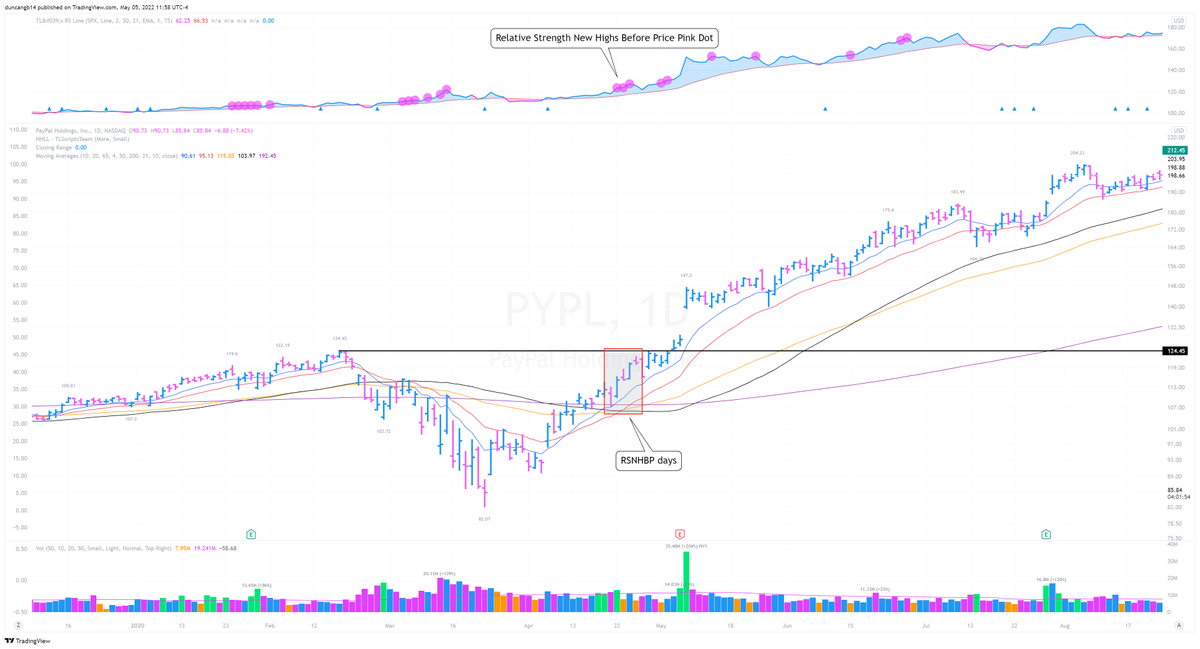
✅ Relative Strength New Highs Before Price (RSNHBP)
This shows us that the relative strength line is making a new high before price, screaming that the stock is holding up much better than the market.
@RossHaber_ @RichardMoglen The RSNHBP characteristic often precedes a big increase in price when overall market pressure is lifted.
Here are some examples:
$PYPL (2020)
$TSLA (2020)
$CUTR (2022)
$LNTH (2022)
@RossHaber_ @RichardMoglen More examples:
$HRT (2022)
$PG (2022)
@RossHaber_ @RichardMoglen Within a base, we should always be looking for the relative strength line to be turning upwards as it comes towards the highs.
This tells us that the strength of the stock is real and not just moving up because the general markets are.
@RossHaber_ @RichardMoglen Another subtle form of relative strength is when a stock bottoms before the general market.
This is telling us that some institution(s) is supporting price and not letting it go lower with the overall market.
@RossHaber_ @RichardMoglen To summarize, proper bases should have the following characteristics:
▪️ Shallow Base Depths
▪️ Prior Uptrend of at least 20%
▪️ Early Stage Base
▪️ Daily & Weekly Accumulation Signatures
▪️ Relative Strength Periods
@RossHaber_ @RichardMoglen The best way to make life changing returns in the market is to study and find these characteristics on your own & apply them to your trading in real time!
That's a wrap!
If you enjoyed this thread:
1. Follow
@TraderLion_ for more stock market content!
2. RT the tweet below to share this thread with your audience 💪
3. Enjoy your Saturday! 🦁
https://t.co/KqSwMcgChY