Titan - After achieving the rectangle target, done with the next minor target of 1920 successfully. Updated chart. https://t.co/rhvYNfqpUI
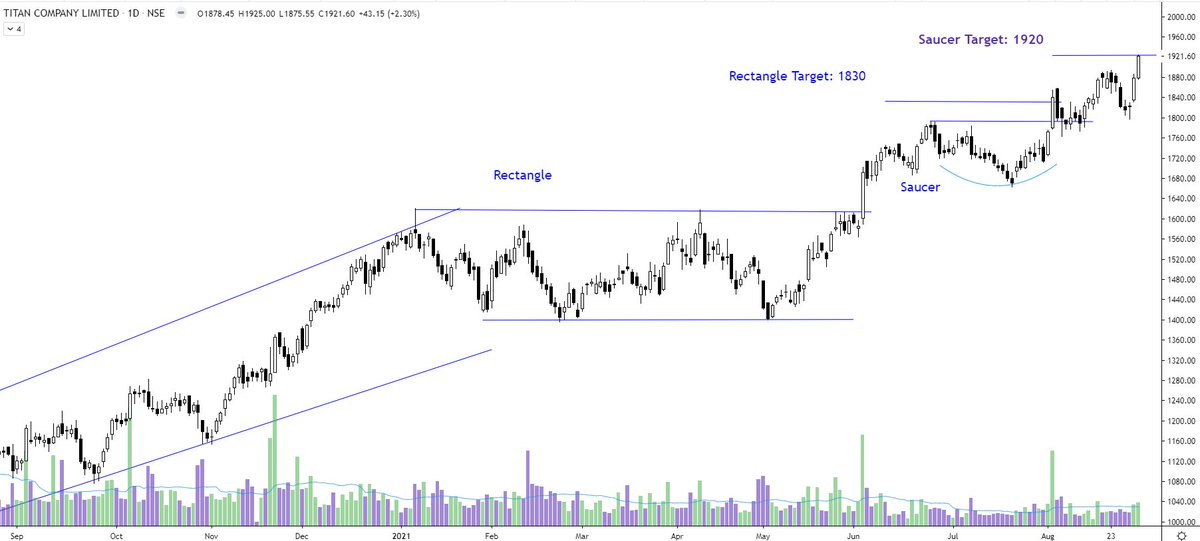
Titan - beautifully on track. Rectangle target done. And now one minor saucer target of 1920. https://t.co/t2OQLibJIs pic.twitter.com/tM5hiLg99e
— The_Chartist \U0001f4c8 (@nison_steve) August 22, 2021
More from The_Chartist 📈
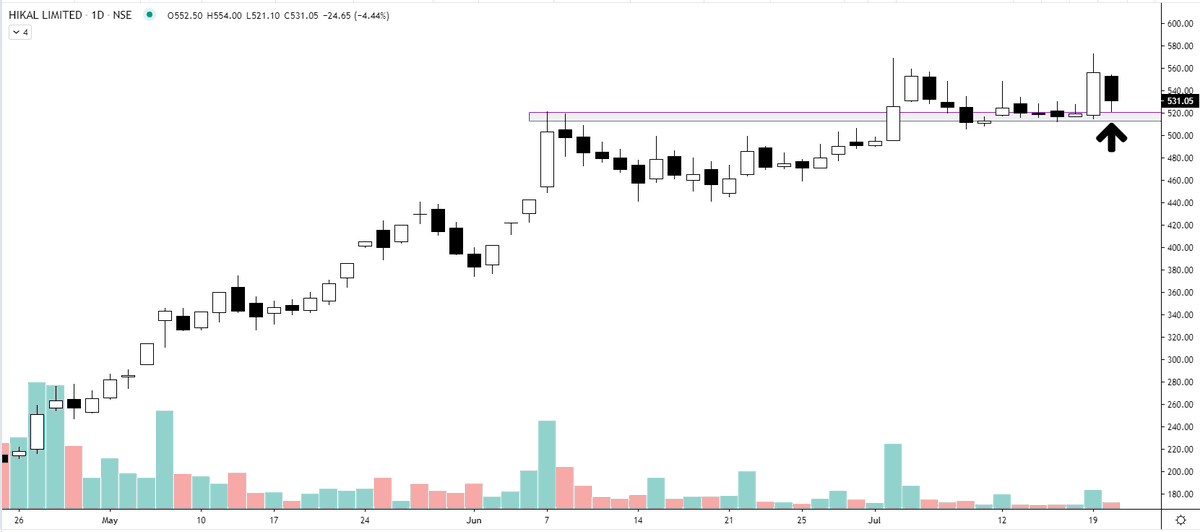
It is important to analyse the strength of the breakout. If the price does not continues the move in 1 or 2 sessions and candles show long upper wicks, it is better to bring the SL closer. Distribution sign.
Will be helpful in next breakouts. https://t.co/AtZOj4bKeT
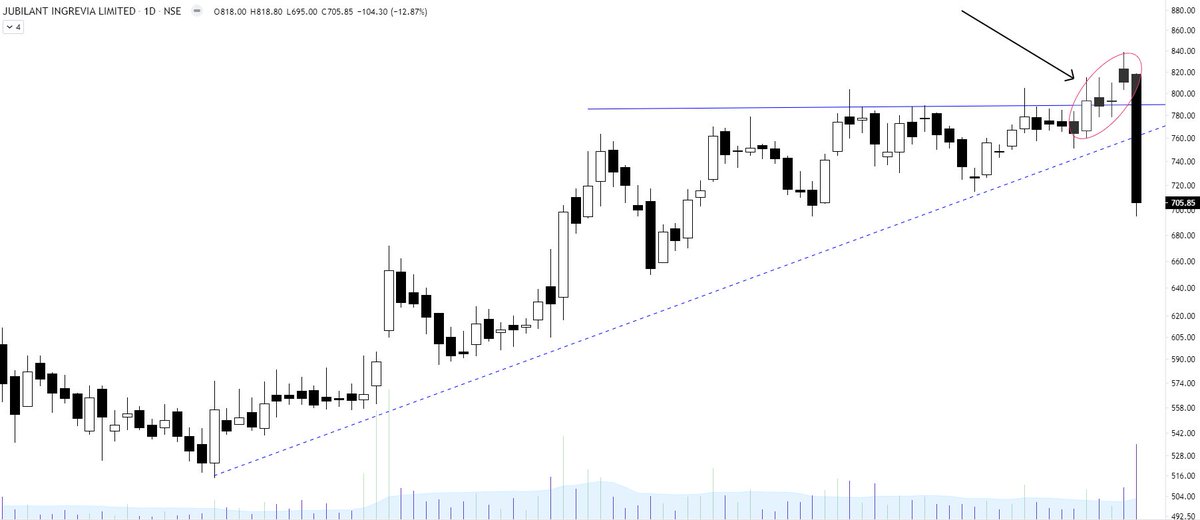
Learning: Strong breakout
— The_Chartist \U0001f4c8 (@nison_steve) July 2, 2021
1. Breakout candle will have no upper shadow or extremely less compared to the body
2. Volumes will be high (to avoid retailers to enter & also big hand absorbing all the selling)
3. Pullbacks will be rare/very less
4. Happens after a long consolidation pic.twitter.com/YTHDOnEdxo
This exercise will tell you about your inherent strengths & weaknesses. 👇👇
How to record a trading journal (TJ) & what to analyze?
— The_Chartist \U0001f4c8 (@charts_zone) December 14, 2021
What is in a TJ?
Buy Date
Stock Name
The time frame you analyzed (D/W/M)
Long/Short?
Buy Price
SL
Sell Price
Risk took (% of capital)
Sell date
No. of days held
P/L
P/L as % of capital
Buy Reason?
Invested capital/trade pic.twitter.com/WnrvmYuOV0
Russell 2000
It is better if you spend considerable time learning these concepts. https://t.co/caBHOO4Owa
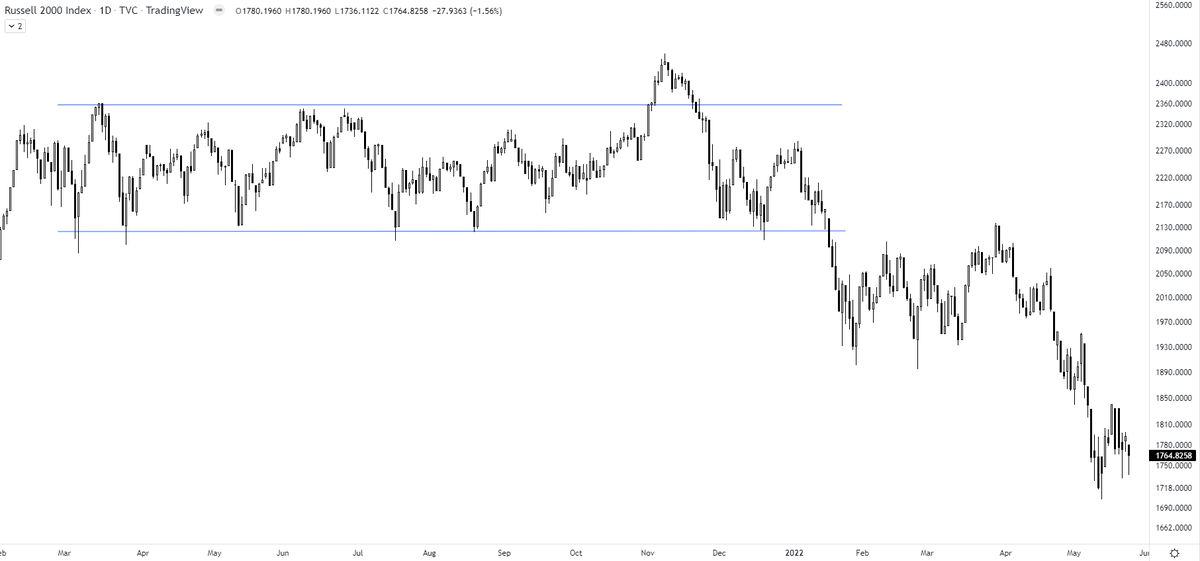
TRAPS? In a false breakout, the price breaks out of the range & comes back within the range. A trap is one step ahead, price not only comes back within the range but breaks down in the opposite direction. It traps the initial longs who didn't close their positions
— The_Chartist \U0001f4c8 (@charts_zone) January 22, 2022
Russell 2000 pic.twitter.com/txzjdnStzc