#DoYouKnow -The place where
Lalitha Sahasranamam -1000 names of Devi originated.
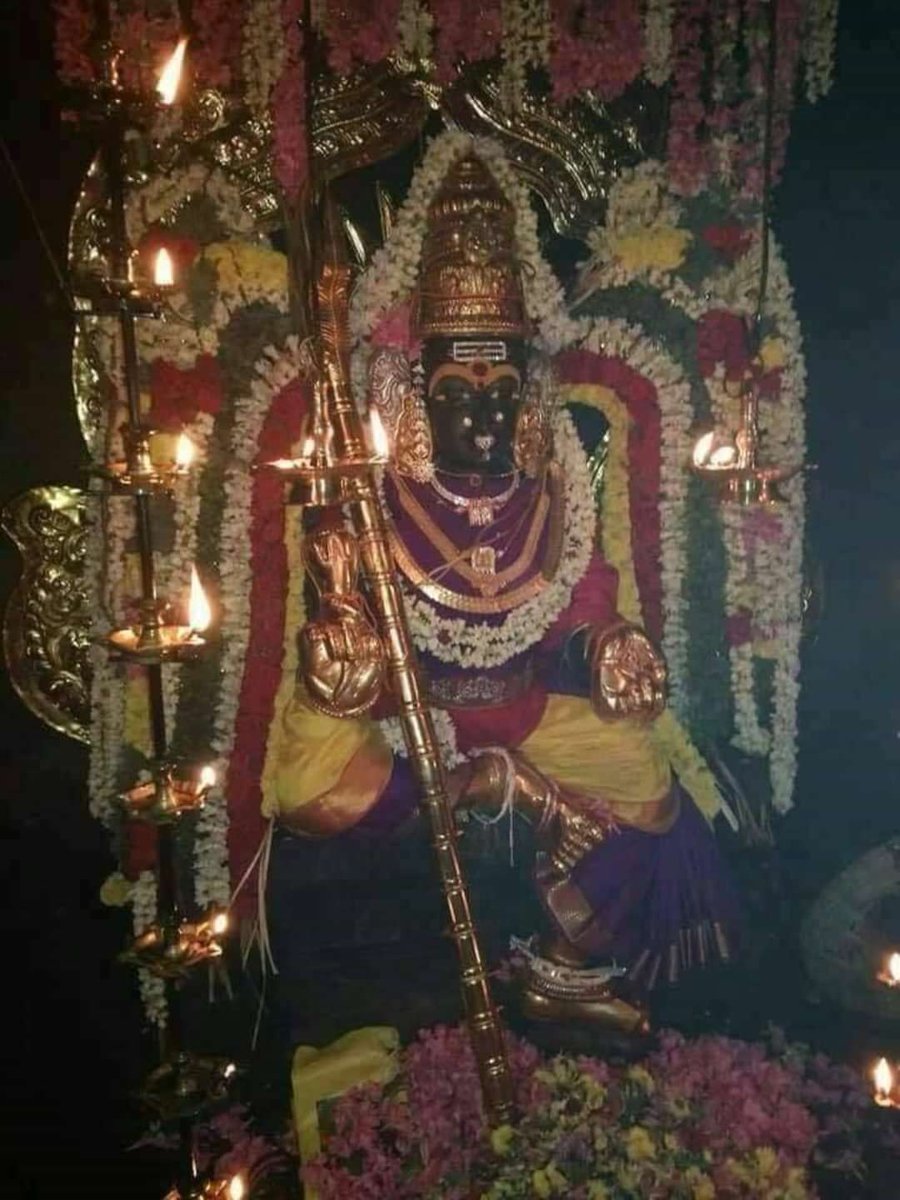
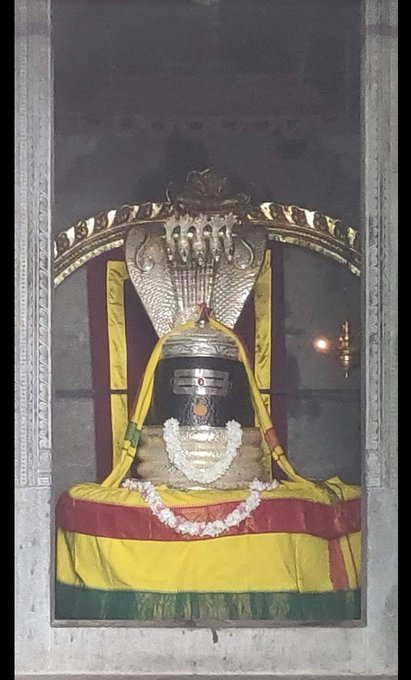
It is in Lalithambigai temple -Thirumeeyachur,Near Mayiladuthurai,TN
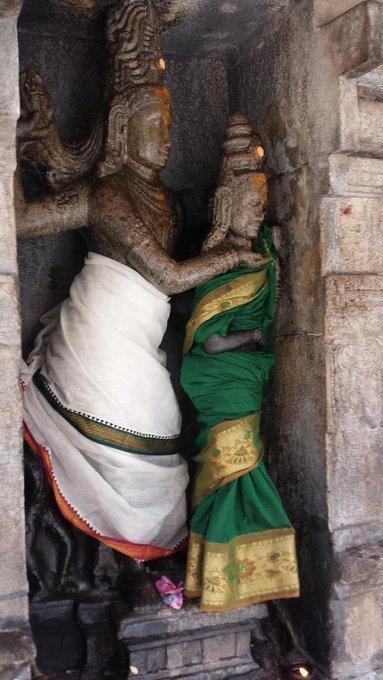
There is a Legend #story & it is related to this beautiful #sculpture of Kshetrapuraneswarar & Ambal Lalithambigai #Thread 👇
#Legend #story
It is believed that this is birth place of Kashyapa Maharishi’s sons, Arunan& Garudan. Arunan(charioteer of Surya)was physically handicapped.He was a Shiva devotee.Arunan wanted to visit Kailash to have Shiva Darshan,but Surya Dev denied permission.
So Arunan disguised as a girl & was on his way to Kailash.On the way Surya Dev saw this girl & outraged her modesty.Shiva was very angry with Suryan for misbehaviour & cursed him to get darkened. Whole world plunged into darkness.Surya Dev pleaded to Bhagwan Shiv to forgive him.
Shiva Bhagwan asked him to go to Thirumiyachur & worship him there. As advised, Surya Dev performed rigorous penance, placed murthi of Shiva& Parvathy on an elephant & took them to the clouds.Shiva in this temple is known as Meganathaswamy,Devi is known as Lalithambigai
Even after severe penance,Shiva does appear,so Surya Dev cries out in agony.Disturbed by his call, Parvathy protests.Siva pacifies her & offers relief to Surya Dev.The sculpture of Shiva pacifying Ambal shows her sullen from one angle &smiling from another.