Wellcome to our virtual walk from Ambleside to Howtown on Lake Ullswater. I’ve based the route on #HadriansHighWay by @fellranger1 which he uses a variant to the main route. Books can be bought direct or through @VindolandaTrust






More from Tech





There has been a lot of discussion about negative emissions technologies (NETs) lately. While we need to be skeptical of assumed planetary-scale engineering and wary of moral hazard, we also need much greater RD&D funding to keep our options open. A quick thread: 1/10
Energy system models love NETs, particularly for very rapid mitigation scenarios like 1.5C (where the alternative is zero global emissions by 2040)! More problematically, they also like tons of NETs in 2C scenarios where NETs are less essential. https://t.co/M3ACyD4cv7 2/10
In model world the math is simple: very rapid mitigation is expensive today, particularly once you get outside the power sector, and technological advancement may make later NETs cheaper than near-term mitigation after a point. 3/10
This is, of course, problematic if the aim is to ensure that particular targets (such as well-below 2C) are met; betting that a "backstop" technology that does not exist today at any meaningful scale will save the day is a hell of a moral hazard. 4/10
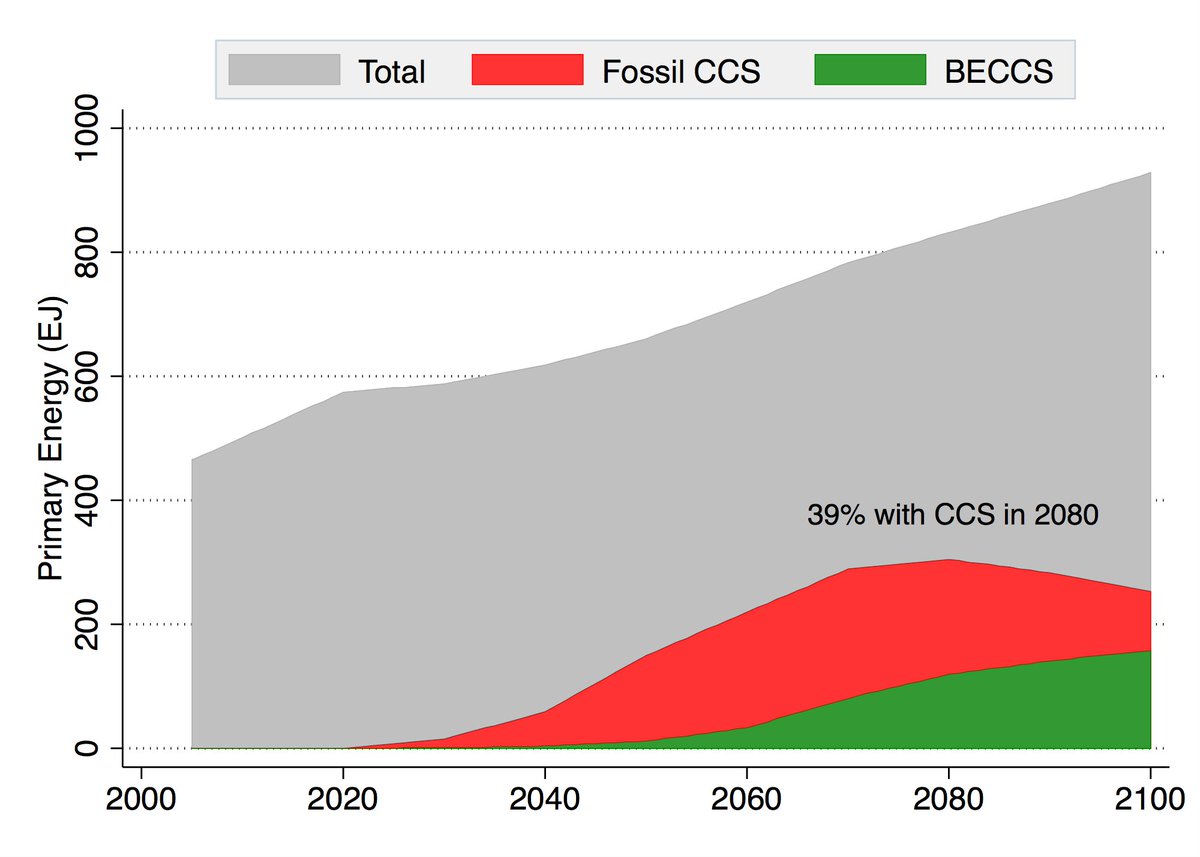
Many models go completely overboard with CCS, seeing a future resurgence of coal and a large part of global primary energy occurring with carbon capture. For example, here is what the MESSAGE SSP2-1.9 scenario shows: 5/10
Energy system models love NETs, particularly for very rapid mitigation scenarios like 1.5C (where the alternative is zero global emissions by 2040)! More problematically, they also like tons of NETs in 2C scenarios where NETs are less essential. https://t.co/M3ACyD4cv7 2/10
There is a lot of confusion about carbon budgets and how quickly emissions need to fall to zero to meet various warming targets. To cut through some of this morass, we can use some very simple emission pathways to explore what various targets would entail. 1/11 pic.twitter.com/Kriedtf0Ec
— Zeke Hausfather (@hausfath) September 24, 2020
In model world the math is simple: very rapid mitigation is expensive today, particularly once you get outside the power sector, and technological advancement may make later NETs cheaper than near-term mitigation after a point. 3/10
This is, of course, problematic if the aim is to ensure that particular targets (such as well-below 2C) are met; betting that a "backstop" technology that does not exist today at any meaningful scale will save the day is a hell of a moral hazard. 4/10
Many models go completely overboard with CCS, seeing a future resurgence of coal and a large part of global primary energy occurring with carbon capture. For example, here is what the MESSAGE SSP2-1.9 scenario shows: 5/10
You May Also Like





1/OK, data mystery time.
This New York Times feature shows China with a Gini Index of less than 30, which would make it more equal than Canada, France, or the Netherlands. https://t.co/g3Sv6DZTDE
That's weird. Income inequality in China is legendary.
Let's check this number.
2/The New York Times cites the World Bank's recent report, "Fair Progress? Economic Mobility across Generations Around the World".
The report is available here:
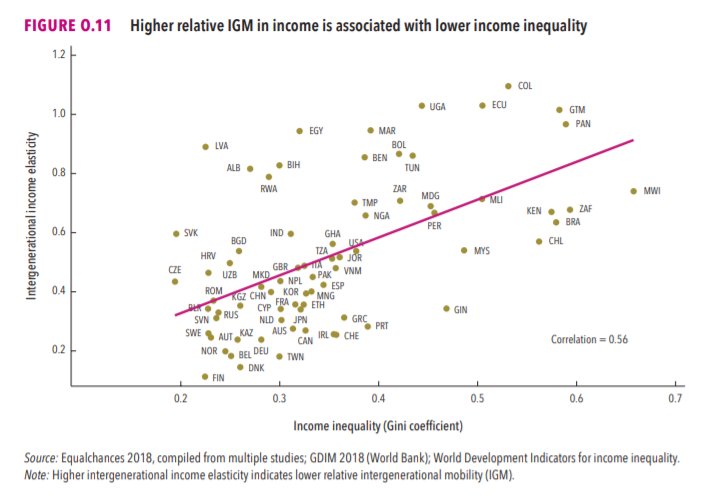
3/The World Bank report has a graph in which it appears to show the same value for China's Gini - under 0.3.
The graph cites the World Development Indicators as its source for the income inequality data.
4/The World Development Indicators are available at the World Bank's website.
Here's the Gini index: https://t.co/MvylQzpX6A
It looks as if the latest estimate for China's Gini is 42.2.
That estimate is from 2012.
5/A Gini of 42.2 would put China in the same neighborhood as the U.S., whose Gini was estimated at 41 in 2013.
I can't find the <30 number anywhere. The only other estimate in the tables for China is from 2008, when it was estimated at 42.8.
This New York Times feature shows China with a Gini Index of less than 30, which would make it more equal than Canada, France, or the Netherlands. https://t.co/g3Sv6DZTDE
That's weird. Income inequality in China is legendary.
Let's check this number.
2/The New York Times cites the World Bank's recent report, "Fair Progress? Economic Mobility across Generations Around the World".
The report is available here:
3/The World Bank report has a graph in which it appears to show the same value for China's Gini - under 0.3.
The graph cites the World Development Indicators as its source for the income inequality data.
4/The World Development Indicators are available at the World Bank's website.
Here's the Gini index: https://t.co/MvylQzpX6A
It looks as if the latest estimate for China's Gini is 42.2.
That estimate is from 2012.
5/A Gini of 42.2 would put China in the same neighborhood as the U.S., whose Gini was estimated at 41 in 2013.
I can't find the <30 number anywhere. The only other estimate in the tables for China is from 2008, when it was estimated at 42.8.