When I look back at my chartbook - get only one lesson.
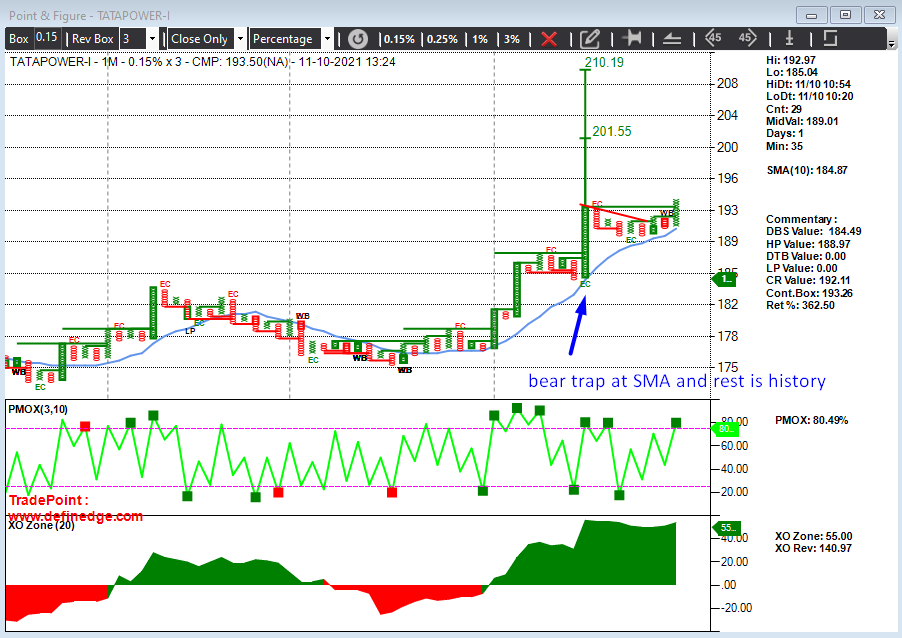
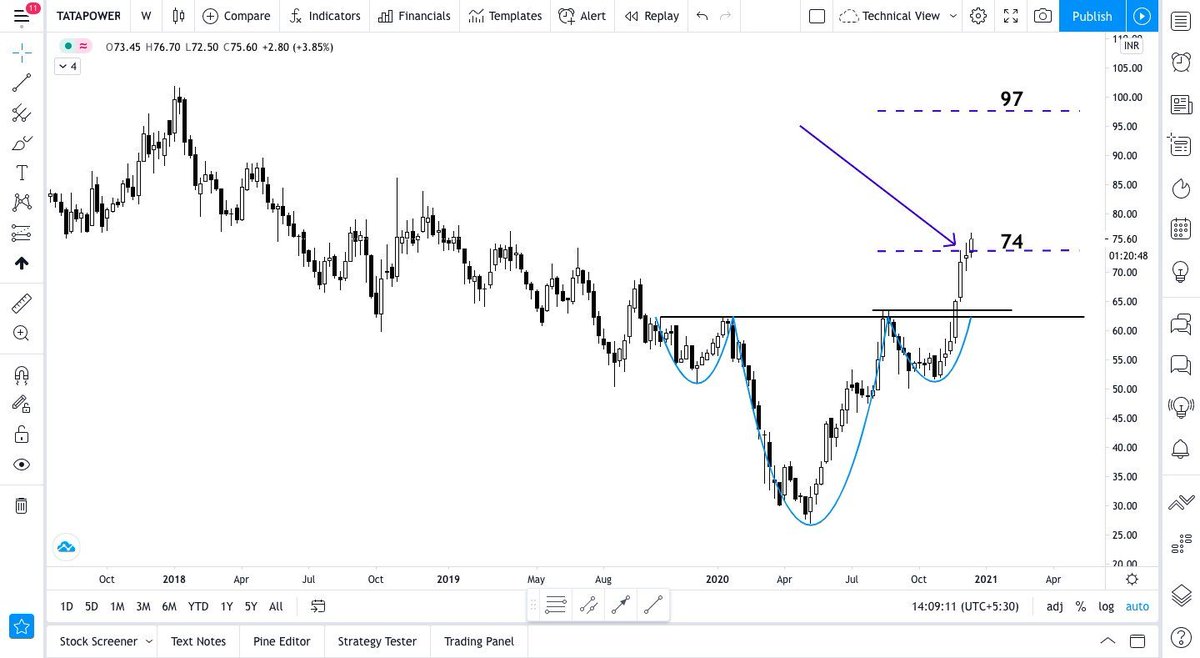
Never ever book your profits at the target. Trail the stock till it goes. For LT investors, long-term charts with MA. Targets are to calculate the R:R ratio at the buy point.
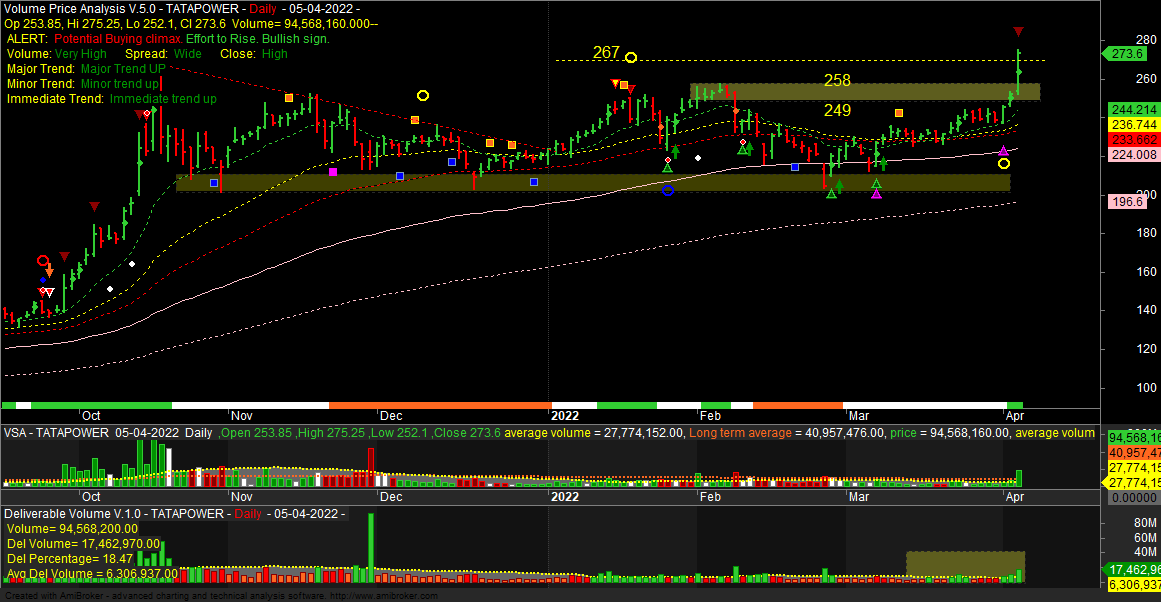
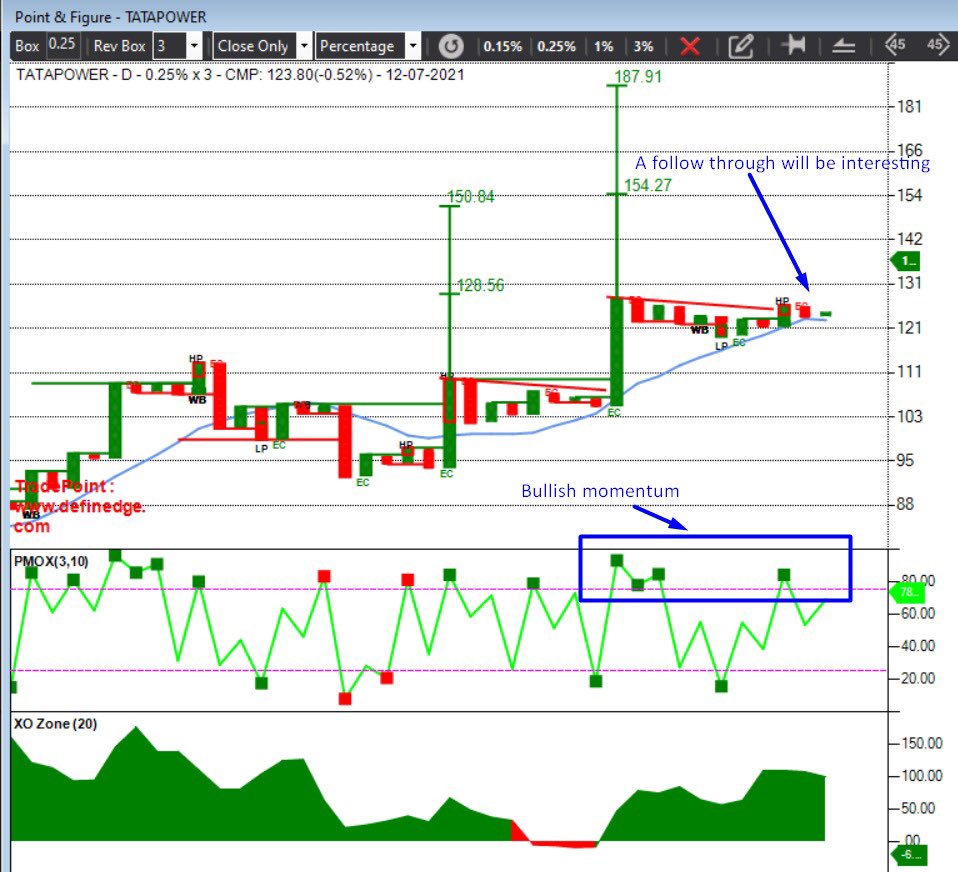
Tata Power
More from The_Chartist 📈
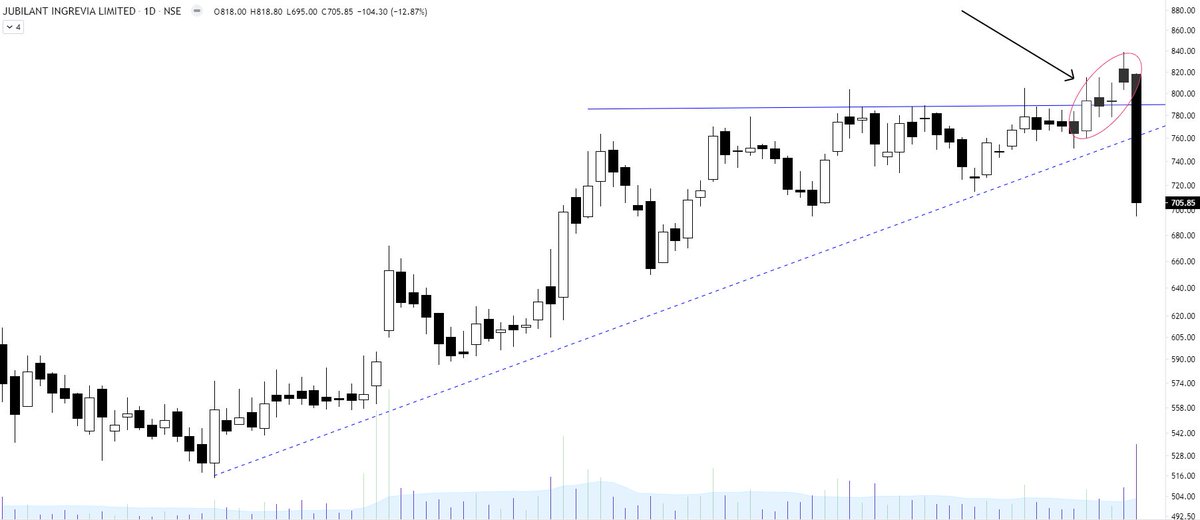
Jubilant Ingrevia - Key learning?
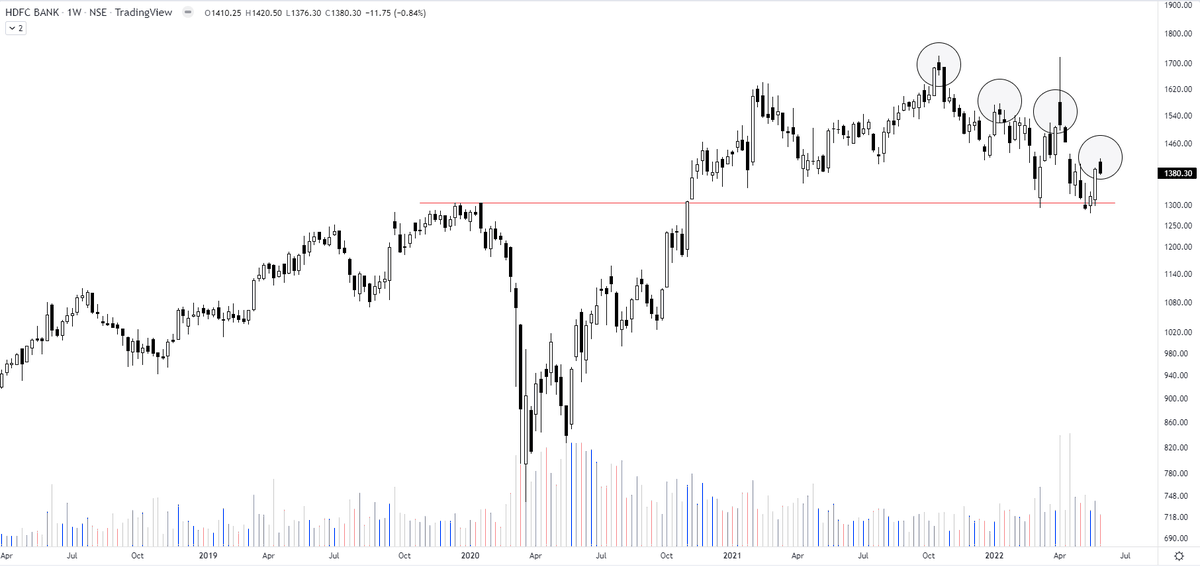
It is important to analyse the strength of the breakout. If the price does not continues the move in 1 or 2 sessions and candles show long upper wicks, it is better to bring the SL closer. Distribution sign.
Will be helpful in next breakouts. https://t.co/AtZOj4bKeT
It is important to analyse the strength of the breakout. If the price does not continues the move in 1 or 2 sessions and candles show long upper wicks, it is better to bring the SL closer. Distribution sign.
Will be helpful in next breakouts. https://t.co/AtZOj4bKeT
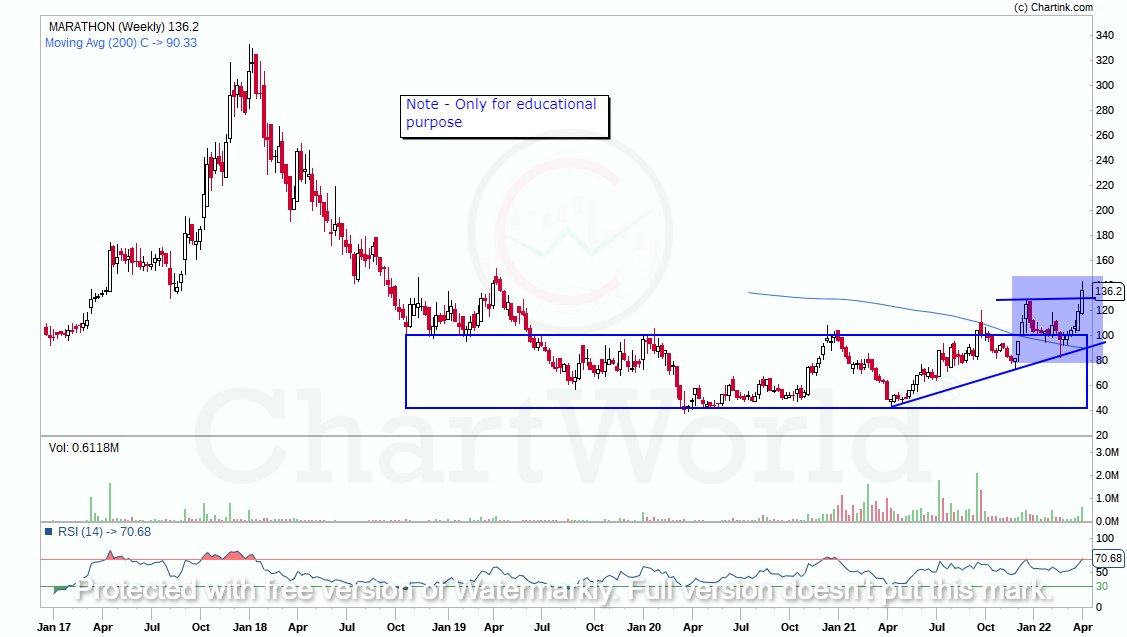
Learning: Strong breakout
— The_Chartist \U0001f4c8 (@nison_steve) July 2, 2021
1. Breakout candle will have no upper shadow or extremely less compared to the body
2. Volumes will be high (to avoid retailers to enter & also big hand absorbing all the selling)
3. Pullbacks will be rare/very less
4. Happens after a long consolidation pic.twitter.com/YTHDOnEdxo