#TataPower coming out of a massive channel...

More from Hardik Upadhyay, CMT.
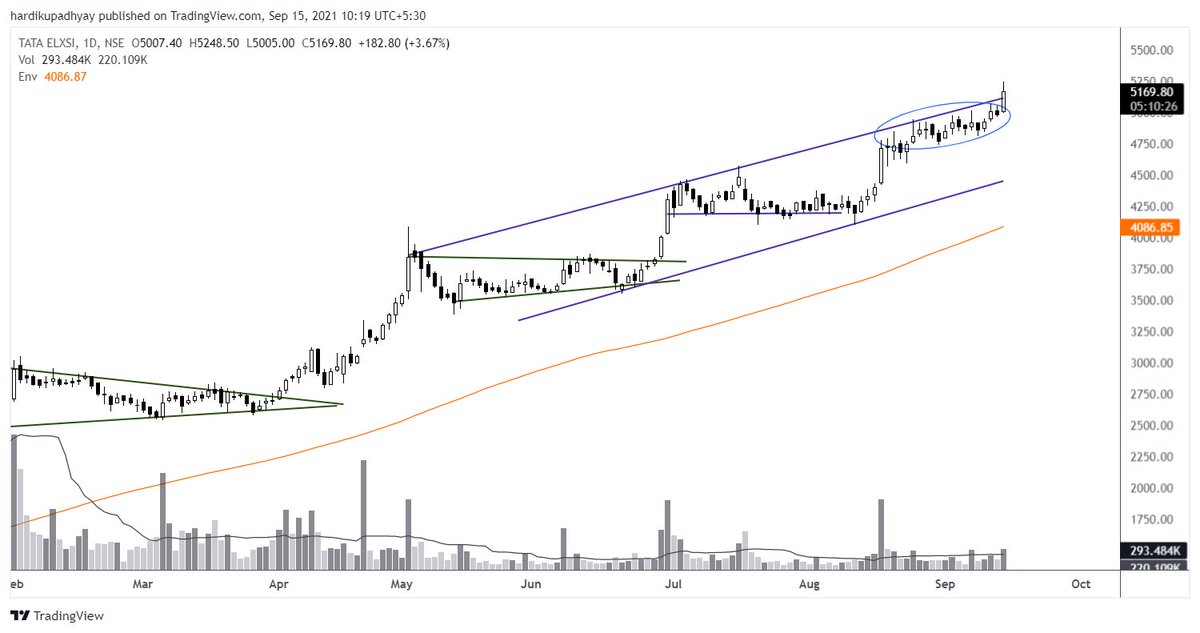

On track to 5850...
As per traditional chart analysis, the breakout from the flag can extend by a distance of the flagpole which gives us the price objective of 5850 or thereabouts.
Let's see what happens!
#ApolloHospital https://t.co/jHgjR2WThe
As per traditional chart analysis, the breakout from the flag can extend by a distance of the flagpole which gives us the price objective of 5850 or thereabouts.
Let's see what happens!
#ApolloHospital https://t.co/jHgjR2WThe
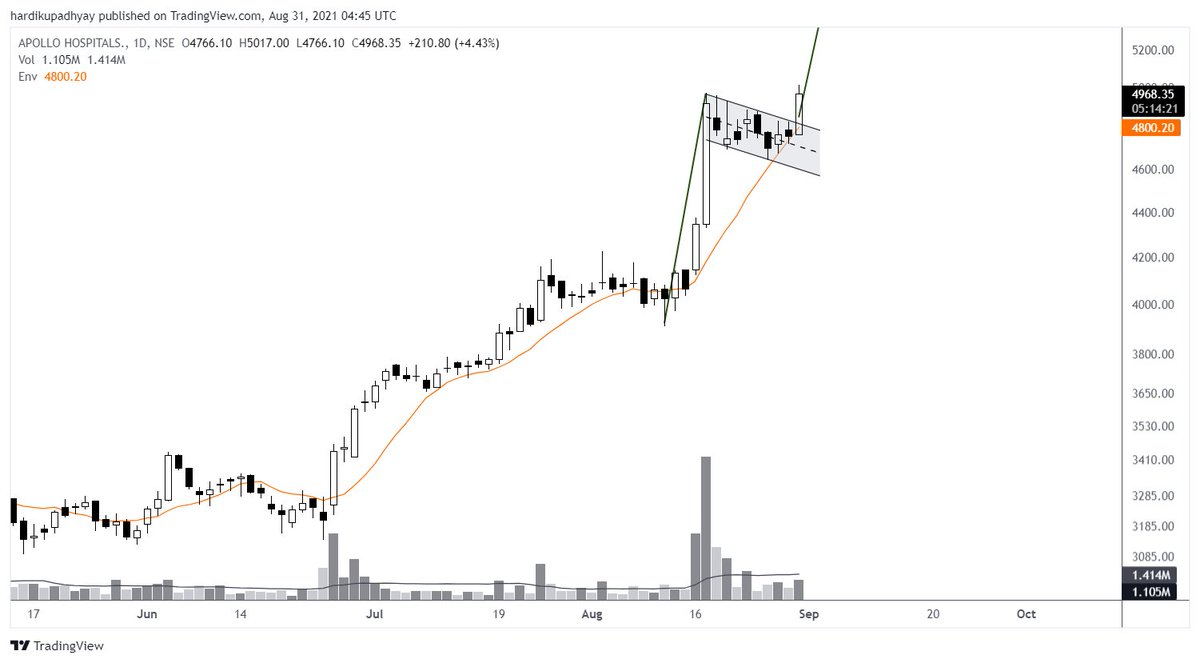
Looks like a Flag to me...
— Hardik Upadhyay, CMT. (@tradingwithdyr) August 30, 2021
A flag pattern is a continuation pattern that suggests a short-term consolidation in opposite direction preceding a strong move.
A breakout above 4850 could have a rapid movement!#ApolloHospitals pic.twitter.com/q7g4enQjRY

More from Tatapower

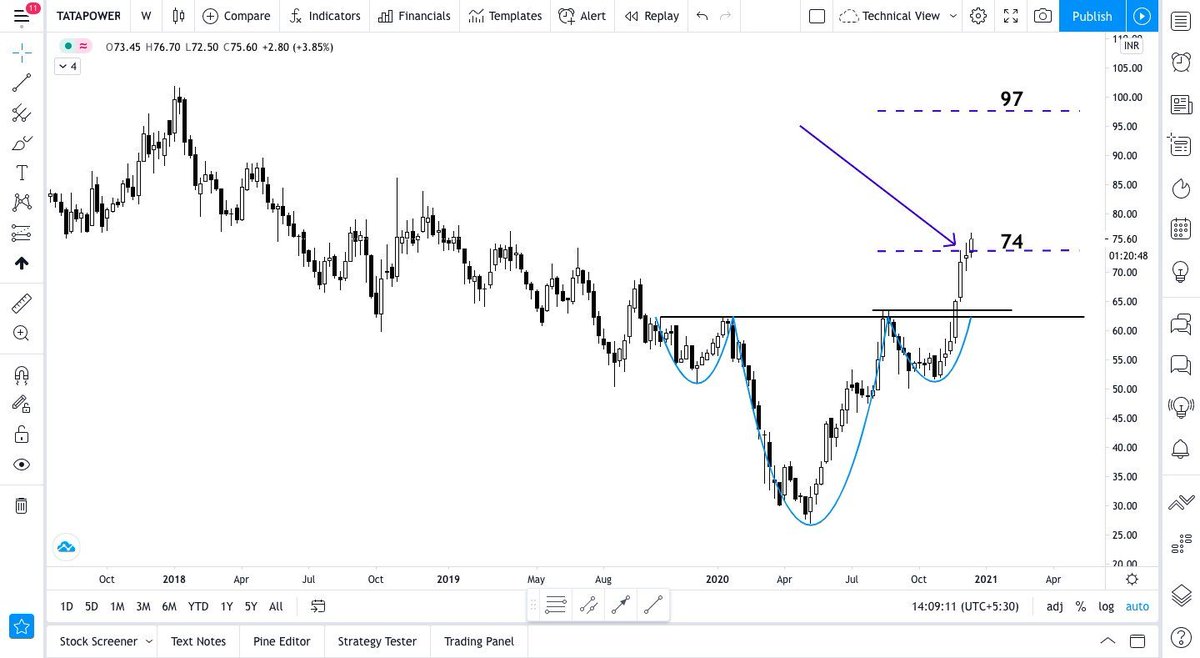

Tata Power - kindly check the attached tweet for price targets. They not only guide us for the next step but also act as considerable resistance whil;e an up move.
Updated chart. https://t.co/KthjKtf6yk
Updated chart. https://t.co/KthjKtf6yk
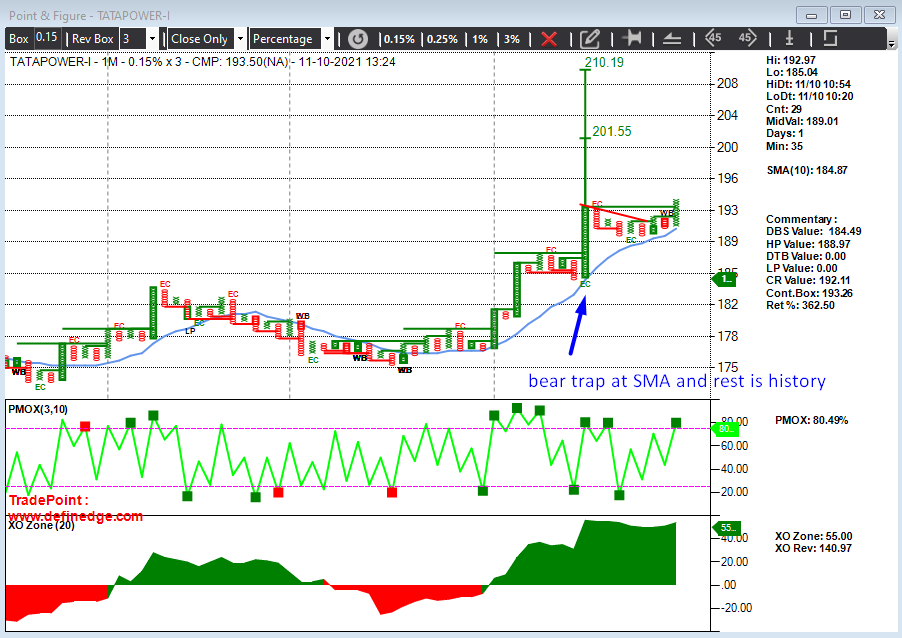
Tata Power - no one was reading my tweet back then but I was still sharing my charts after I joined Twitter.
— The_Chartist \U0001f4c8 (@nison_steve) October 11, 2021
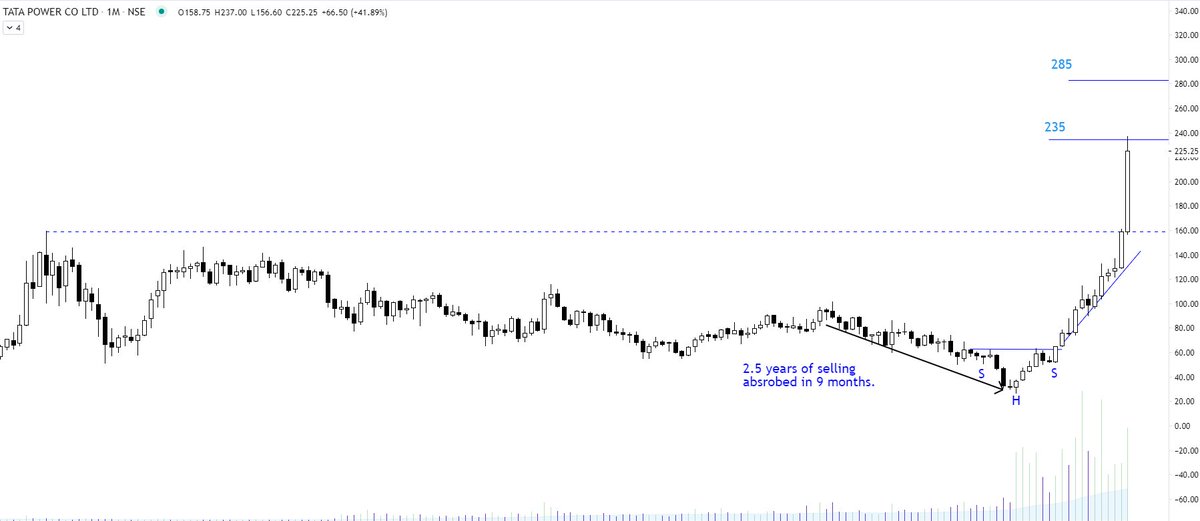
Otw to 235 & 285 https://t.co/JgvNjKT3al pic.twitter.com/9NY2Y6ZFHT


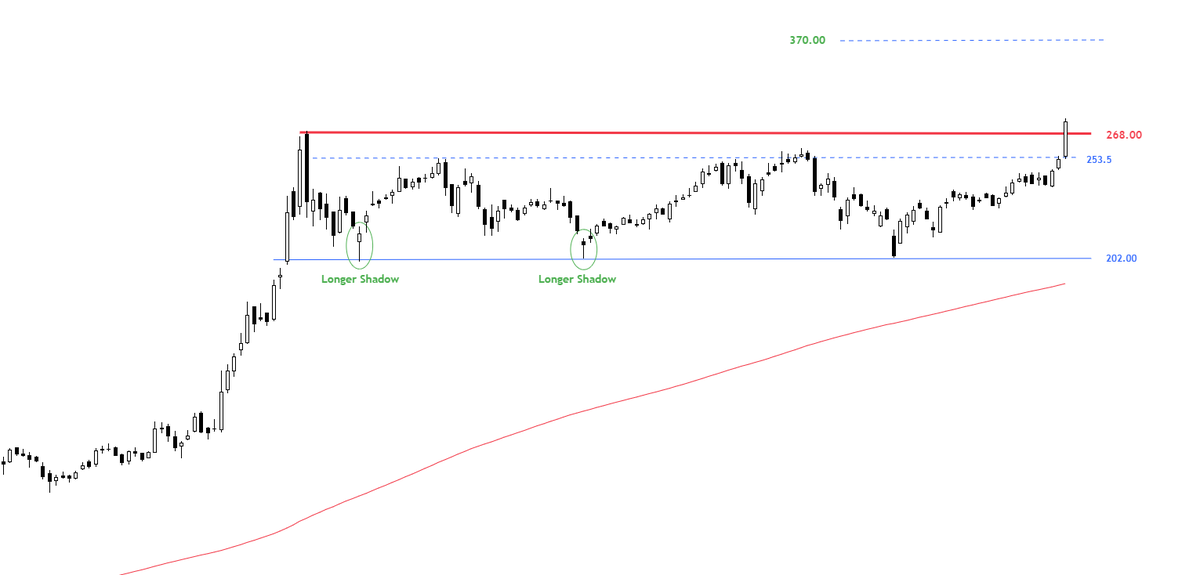
Price provides additional benefit if we enter near a well defined boundary above 200 DMA , after any reversal candle .
Near well defined support our work is only Manage the risk and qty .
#tatapower update chart setup
#Investment #stocks #StockMarket https://t.co/Wkv8YDSFJ6
Near well defined support our work is only Manage the risk and qty .
#tatapower update chart setup
#Investment #stocks #StockMarket https://t.co/Wkv8YDSFJ6
#tatapower chart #update
— Prasanta Pradhan \U0001f1ee\U0001f1f3 (@Mysterychart) March 29, 2022
I just love horizontal boundary #Investment #investing #StockMarket https://t.co/rfuzNq2Peq pic.twitter.com/5LtHjp6UCy
You May Also Like


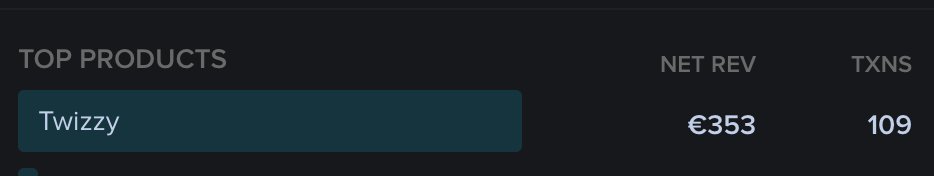
To people who are under the impression that you can get rich quickly by working on an app, here are the stats for https://t.co/az8F12pf02
📈 ~12000 vistis
☑️ 109 transactions
💰 353€ profit (285 after tax)
I have spent 1.5 months on this app. You can make more $ in 2 days.
🤷♂️
I'm still happy that I launched a paid app bcs it involved extra work:
- backend for processing payments (+ permissions, webhooks, etc)
- integration with payment processor
- UI for license activation in Electron
- machine activation limit
- autoupdates
- mailgun emails
etc.
These things seemed super scary at first. I always thought it was way too much work and something would break. But I'm glad I persisted. So far the only problem I have is that mailgun is not delivering the license keys to certain domains like https://t.co/6Bqn0FUYXo etc. 👌
omg I just realized that me . com is an Apple domain, of course something wouldn't work with these dicks