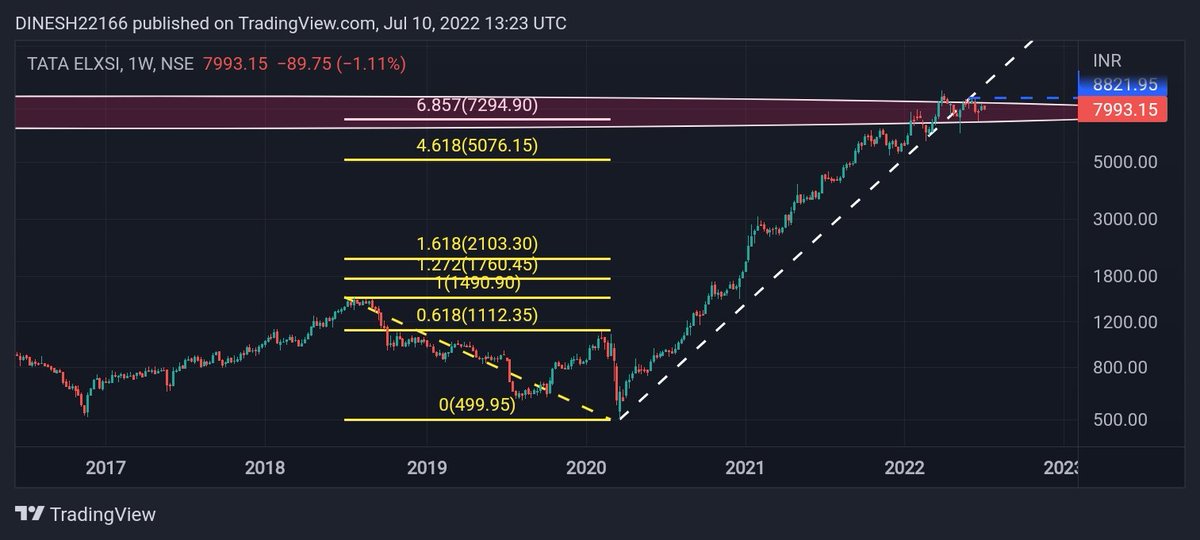
#TataElxsi has important support near 7100
In weekly chart RSI has dipped below 50
If the #stock breaks its long term support trendline and sustains below 7000, we can see serious correction in the stock
#stocks #Nifty
Not a trading call, academic post
More from Techno Prince
Pls go to Nifty daily chart, convert candle stick chart to line chart
Make time period Weekly
Then click on the encircled + sign in top panel to add different index to compare, u can add any index
Will describe this in our Friday post market session, watch in SE YouTube channel
Make time period Weekly
Then click on the encircled + sign in top panel to add different index to compare, u can add any index
Will describe this in our Friday post market session, watch in SE YouTube channel
Sir can u please make a video on how to get this plotted in trading view .Please sir .a small guidance will be highly appreciated .I know there are many like me who don't know to plot it but are shy to admit .it would benefit them too .thank u sir
— rajesh shetty (@shettyrajeshs) May 4, 2021
More from Tataelxsilongterm
Reasons-
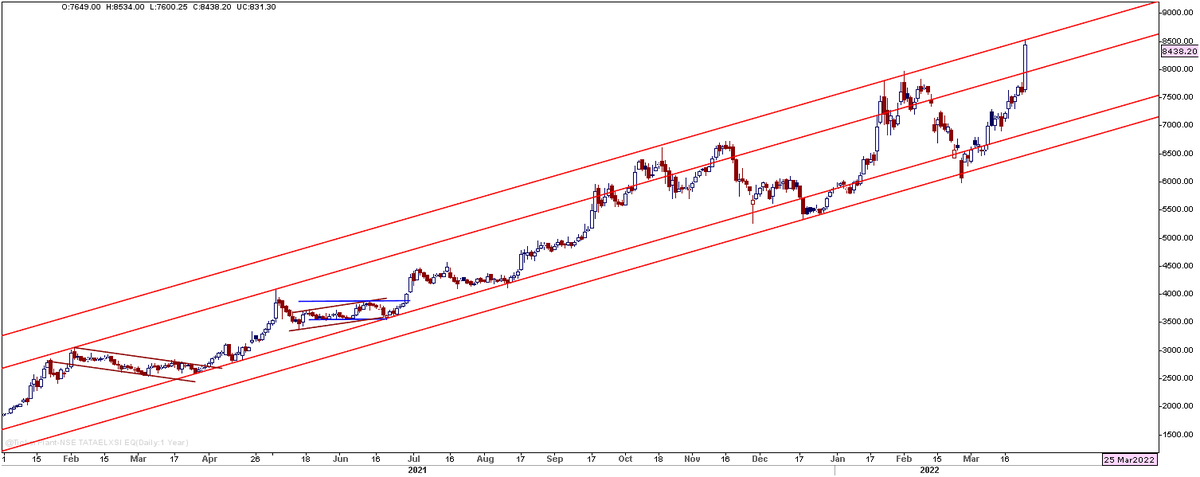
1. Long term channel top.
2. Curvature shift of 20 and 50 WMA along with price hitting 20 WMA frequently.
3. Overall weakness in IT sector.
4. For reference, study reliance top in August 2020, study Nasdaq Weekly chart and the top made in Nov 2021.
#tataelxi https://t.co/RmJa5LrdAP
1. Long term channel top.
2. Curvature shift of 20 and 50 WMA along with price hitting 20 WMA frequently.
3. Overall weakness in IT sector.
4. For reference, study reliance top in August 2020, study Nasdaq Weekly chart and the top made in Nov 2021.
#tataelxi https://t.co/RmJa5LrdAP
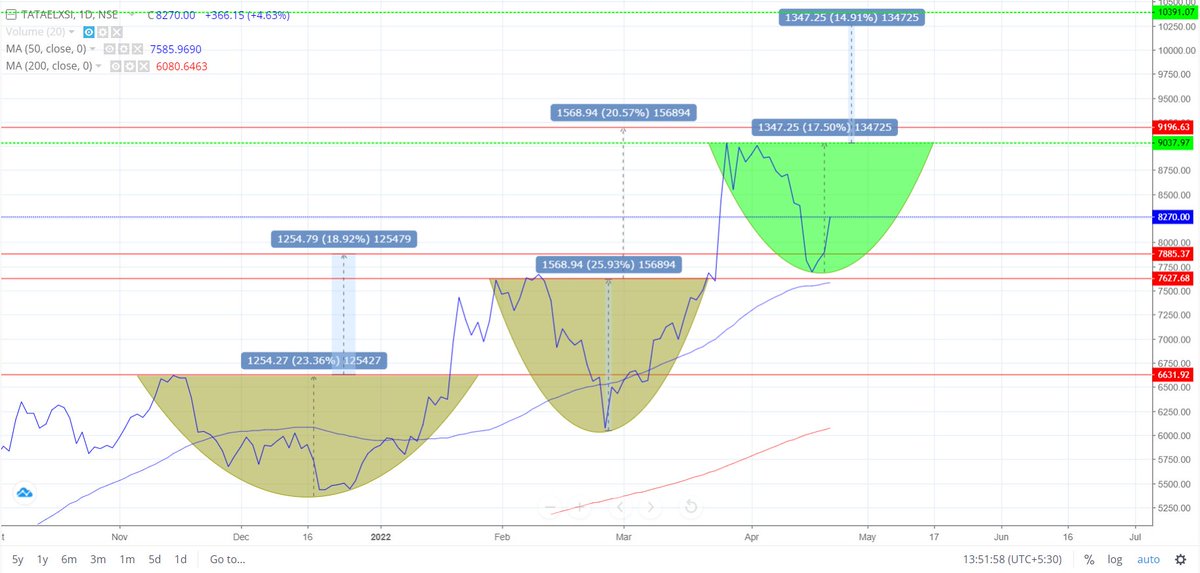
I have traded the current fav Tata Elxi from 2200 to 4500. No regret on missing out rest of the move because I am not an investor. Now there are many technical red flags. I might be trolled but 10.5k looks max target while 5k or 3-4 years of sideways looks inevitable.#tataelxi
— Aakash Gangwar (@akashgngwr823) March 26, 2022