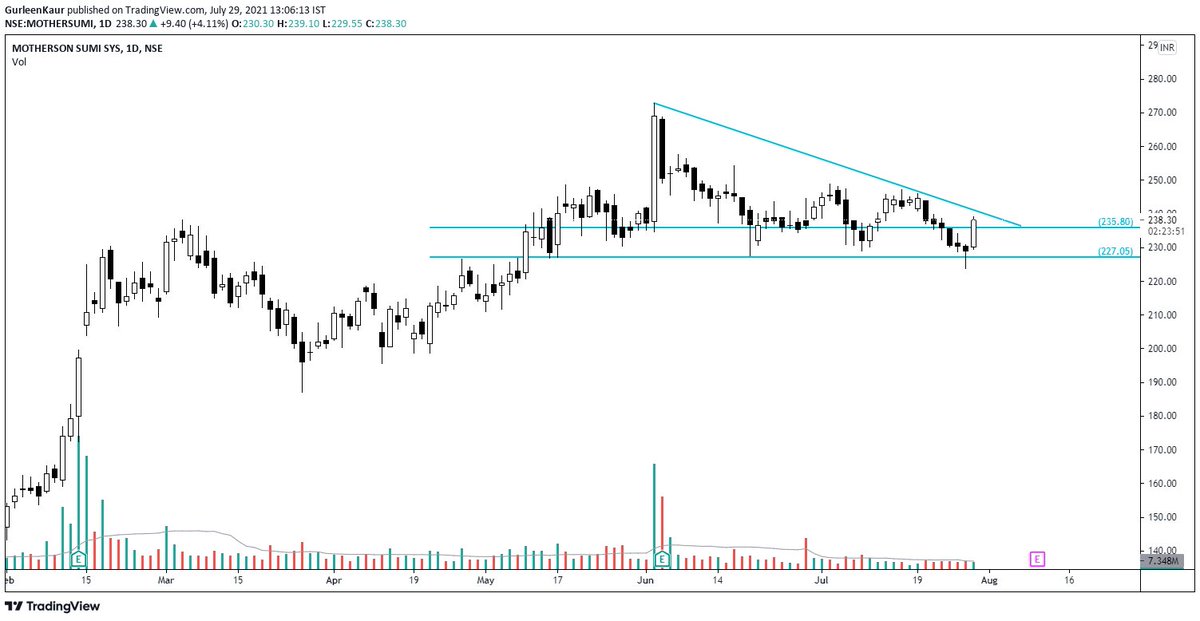
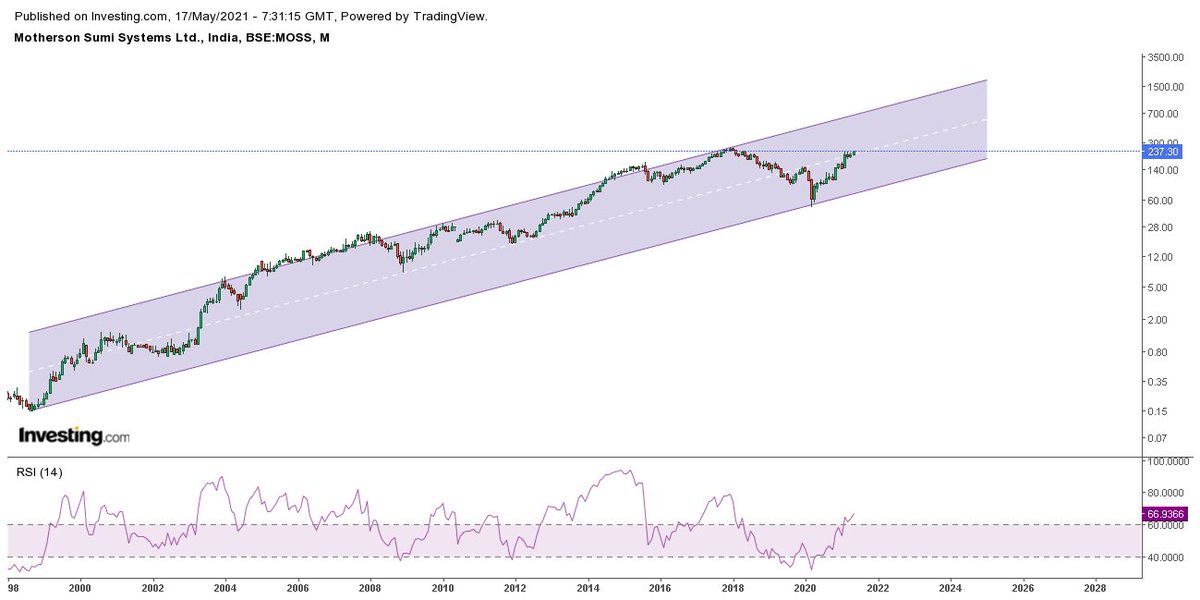
Channel upmove in #MOTHERSUMI . Weekly chart has RSI 50+ and surging, if the stock is able to breach and sustain above 242, it may look to retest 2017 Dec high of approx 264.
Not a trading call , academic post

More from Techno Prince


More from Motherson

#MothersonSumi above 241, the stock could head to previous ATH around 260 levels. Beyond that bigger targets open up. In my view, the stock has resumed its next up trend. https://t.co/mG4Q0N1lyL
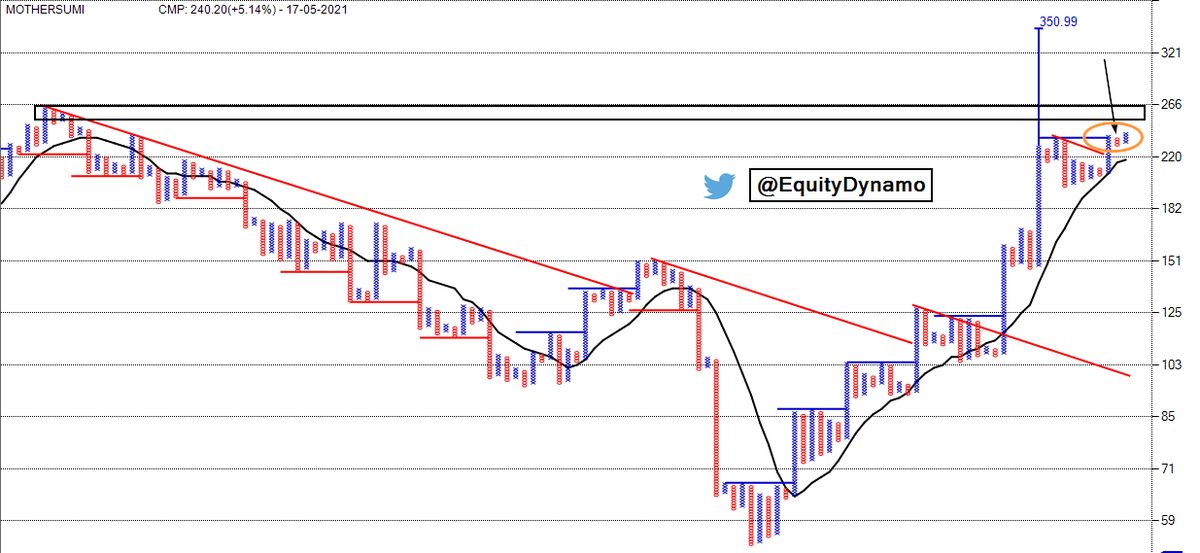
#MothersonSumi Breaking out@caniravkaria pic.twitter.com/lpcR1J8r7H
— Dare2Dream (@Dare2Dr10109801) May 12, 2021