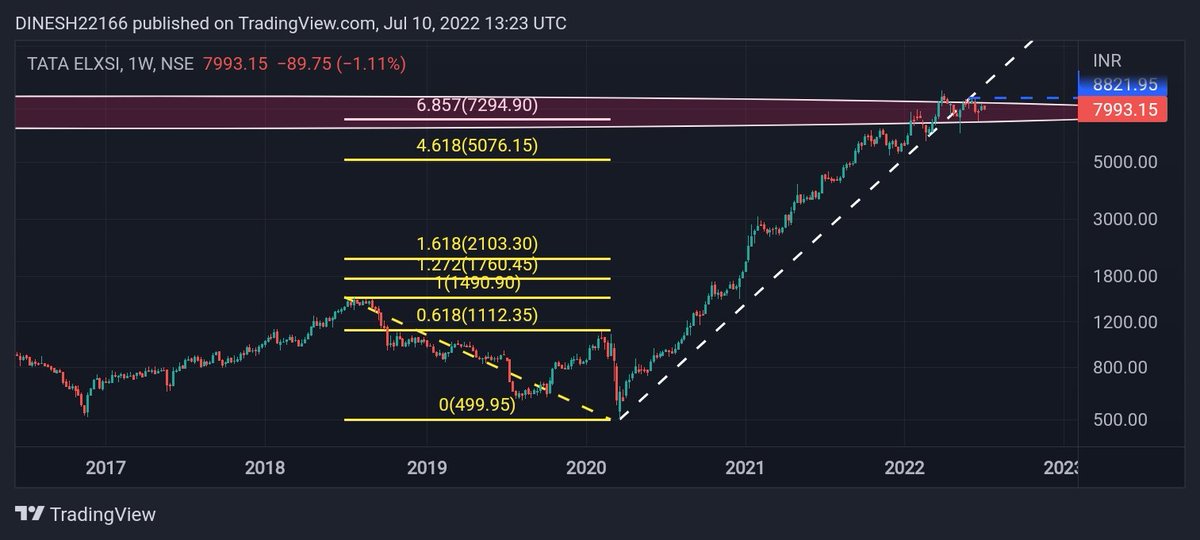
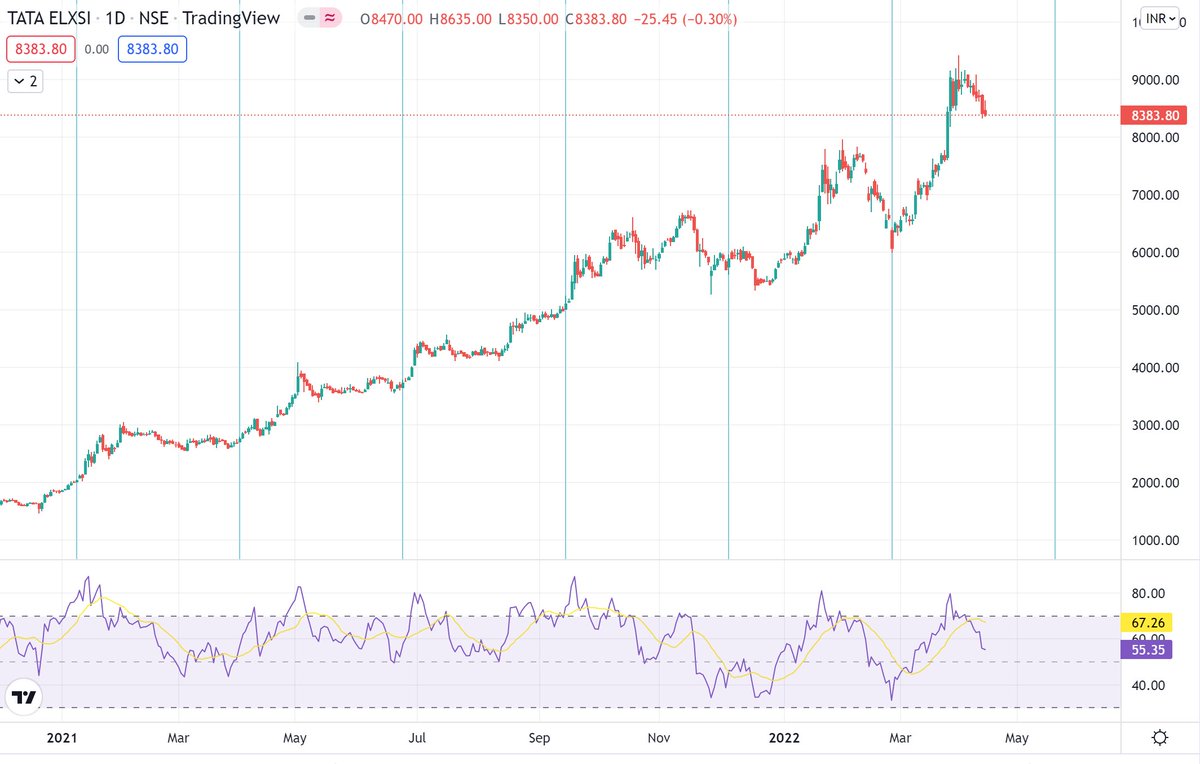
#TATAELXSI-7993
Weekly chart.
Trend line breakdown witness on weekly chart. Same face #resistance at 8822.
#Exit_strategy cash on hand, even if you don't want.
Weekly closing below 7294 put all set for downside.
#Probability
More from Waves_Perception(Dinesh Patel) मैंSchedule Tribe)
More from Tataelxsilongterm


You May Also Like

The entire discussion around Facebook’s disclosures of what happened in 2016 is very frustrating. No exec stopped any investigations, but there were a lot of heated discussions about what to publish and when.
In the spring and summer of 2016, as reported by the Times, activity we traced to GRU was reported to the FBI. This was the standard model of interaction companies used for nation-state attacks against likely US targeted.
In the Spring of 2017, after a deep dive into the Fake News phenomena, the security team wanted to publish an update that covered what we had learned. At this point, we didn’t have any advertising content or the big IRA cluster, but we did know about the GRU model.
This report when through dozens of edits as different equities were represented. I did not have any meetings with Sheryl on the paper, but I can’t speak to whether she was in the loop with my higher-ups.
In the end, the difficult question of attribution was settled by us pointing to the DNI report instead of saying Russia or GRU directly. In my pre-briefs with members of Congress, I made it clear that we believed this action was GRU.
The story doesn\u2019t say you were told not to... it says you did so without approval and they tried to obfuscate what you found. Is that true?
— Sarah Frier (@sarahfrier) November 15, 2018
In the spring and summer of 2016, as reported by the Times, activity we traced to GRU was reported to the FBI. This was the standard model of interaction companies used for nation-state attacks against likely US targeted.
In the Spring of 2017, after a deep dive into the Fake News phenomena, the security team wanted to publish an update that covered what we had learned. At this point, we didn’t have any advertising content or the big IRA cluster, but we did know about the GRU model.
This report when through dozens of edits as different equities were represented. I did not have any meetings with Sheryl on the paper, but I can’t speak to whether she was in the loop with my higher-ups.
In the end, the difficult question of attribution was settled by us pointing to the DNI report instead of saying Russia or GRU directly. In my pre-briefs with members of Congress, I made it clear that we believed this action was GRU.