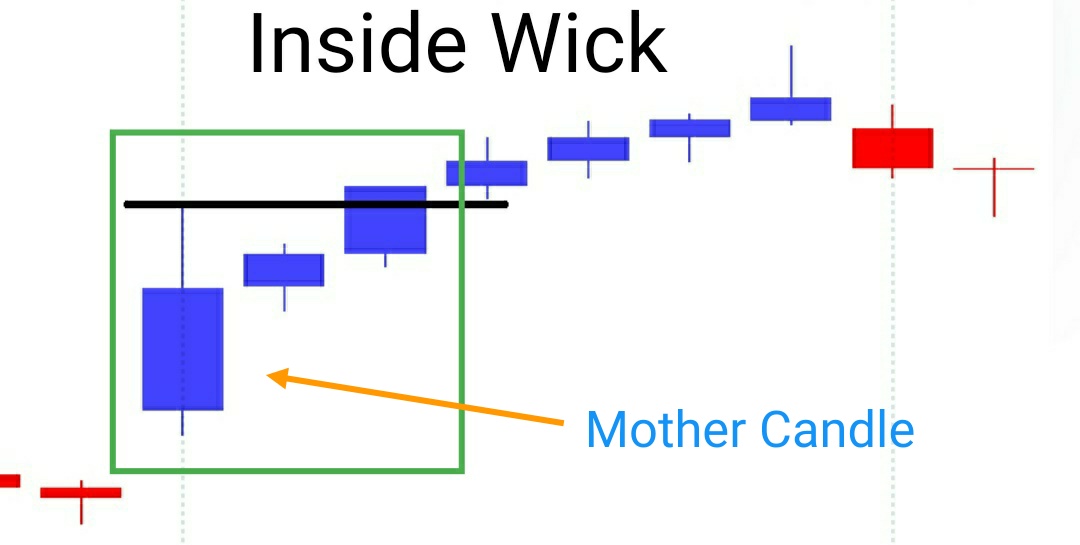
Few #Patterns to master.
Disc* Found on internet.

More from ₹ohan $hah


More from Stockslearnings

1/n
Dear @chartmojo
Out of curiosity, just gone through your timeline and prepared a data of your shared tweets in OCT'2020;
You will not believe the following numbers:
Charts shared = 29 (2 excluded due to splits)
Period = 8-oct to 30-oct'20
..
2/n
If min.10k invested on your each design, then
Amount invested in Oct'20 = 2.91 lacs
Present investment value = 4.72 lacs
Maximum drawdown = 9%
ROI = 62% in 200 days
Annualized ROI = 147%
**You ROCK brother**
...
I've prepared a sheet for all your Oct'20 tweets; It was so much learning on the charts as well as on the data-part; Please keep on the good work.
Sheet link:
https://t.co/8BJtMsOkBD
With regards,
Deepak


In such a case, H&S can be either a continuation pattern or compound fulcrum.
This is how to differentiate:
• if right shoulder is smaller than left, most likely a continuation H&S
• if right is same or higher than left, and the price is not coming to neckline, most likely CF
This is how to differentiate:
• if right shoulder is smaller than left, most likely a continuation H&S
• if right is same or higher than left, and the price is not coming to neckline, most likely CF
sir a doubt does head & shoulders work in down trend ? pic.twitter.com/dytYmbzOfp
— Vega_Greek (@VegaGreek) May 13, 2021