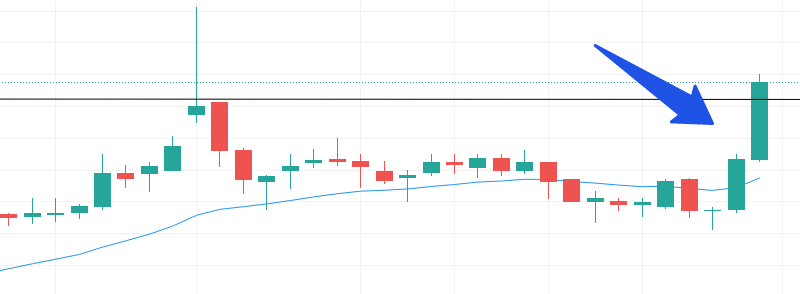
1 FMCG stock chart has so much to teach -
1) Cup
2) Handle
3) BO
4) Retest
5) Bearish RSI divergence
What is obvious, USUALLY doesn't play out #StockMarket
More from Kool Aggarwal



More from Stockslearnings

🧵Top 20 best tweets of the week: 30th Oct 🧵
Thread's on:
• How to find targets and exit criteria?
• Shanon's Demon (Investing)
• Tradingview scanner- Intraday/BTST
• 90-degree angle inflection point for profit-booking
• Importance of Leverage
Other cool tweets as well.
🧵Shannon's Demon - an investing "thought exercise"
This account writes the best threads, if you like the threads I make, you will surely love this account. Must
🧵Finding expected targets and exit criteria to look for to exit the
🧵Trading View Scanner process to trade in momentum stocks.
🧵90-degree angle inflection point for
Thread's on:
• How to find targets and exit criteria?
• Shanon's Demon (Investing)
• Tradingview scanner- Intraday/BTST
• 90-degree angle inflection point for profit-booking
• Importance of Leverage
Other cool tweets as well.
🧵Shannon's Demon - an investing "thought exercise"
This account writes the best threads, if you like the threads I make, you will surely love this account. Must
1/
— 10-K Diver (@10kdiver) October 23, 2021
Get a cup of coffee.
In this thread, I'll walk you through Shannon's Demon.
This is an investing "thought exercise" -- posed by the great scientist Claude Shannon.
Solving this exercise can teach us a lot about favorable vs unfavorable long-term bets, position sizing, etc.
🧵Finding expected targets and exit criteria to look for to exit the
How to find out the expected targets and what should be the exit criteria when you enter a trade - \U0001f9f5
— Sheetal Rijhwani (@RijhwaniSheetal) October 25, 2021
Possible ways to find out the target:
Check if any patterns forming - it gets quite easy to figure out the targets that way. (1/15)
🧵Trading View Scanner process to trade in momentum stocks.
Trading view scanner process -
— Vikrant (@Trading0secrets) October 23, 2021
1 - open trading view in your browser and select stock scanner in left corner down side .
2 - touch the percentage% gain change ( and u can see higest gainer of today) https://t.co/GGWSZXYMth
🧵90-degree angle inflection point for
The 90 degree angle inflection point in a stock is a signal to book profit
— Nikita Poojary (@niki_poojary) October 24, 2021
Lets understand with a recent example of a stock #IRCTC \U0001f683\U0001f68b
Time for a thread\U0001f9f5


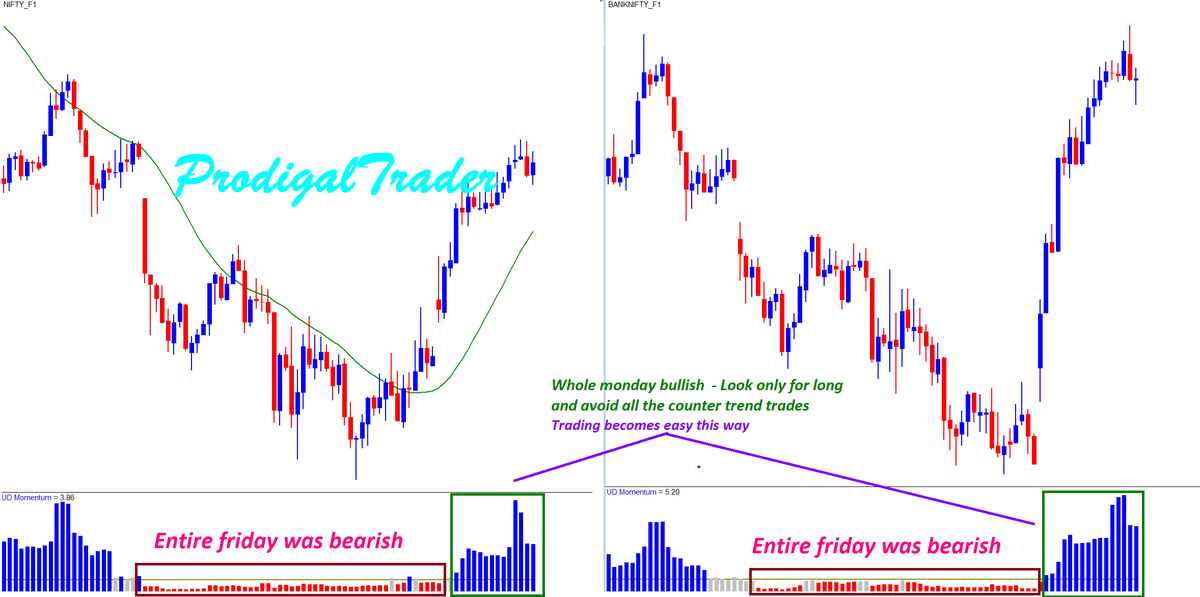
I have explained the importance of meeasuring momentum of the trend.
U can guage the strength in the trend once u know how to measure the direction.
This trend strength is infact signals the trend continuity or the potetnial for sustanining the trend.
Thats great assurace to hav https://t.co/HanLvlXkjQ
U can guage the strength in the trend once u know how to measure the direction.
This trend strength is infact signals the trend continuity or the potetnial for sustanining the trend.
Thats great assurace to hav https://t.co/HanLvlXkjQ
Before making ur trade entry or even before making a bias of trend as either bullish or bearish, do u use any objective measures to define the trend based on price, volume and momentum?
— Aneesh Philomina Antony (@ProdigalTrader) May 15, 2021
Price will always go back and forth move no matter how strong the trend is.
1/4 pic.twitter.com/qqizh2JO3J

You May Also Like

Keep dwelling on this:
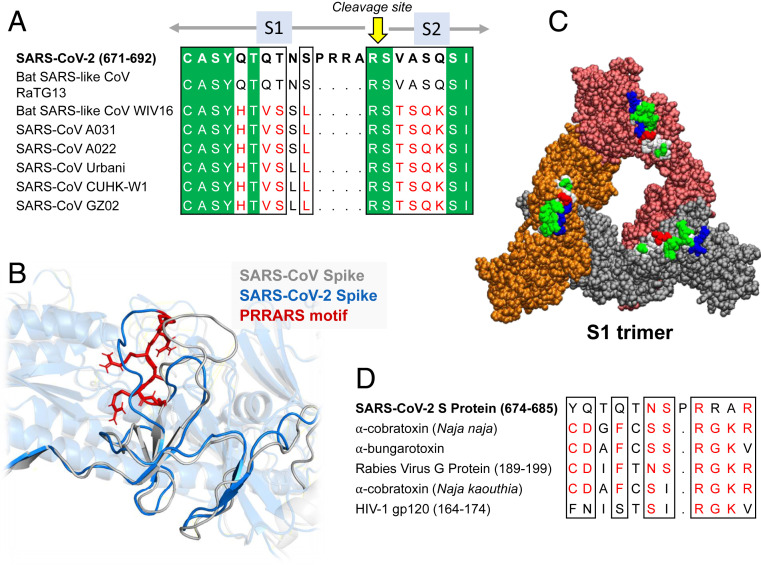
Further Examination of the Motif near PRRA Reveals Close Structural Similarity to the SEB Superantigen as well as Sequence Similarities to Neurotoxins and a Viral SAg.
The insertion PRRA together with 7 sequentially preceding residues & succeeding R685 (conserved in β-CoVs) form a motif, Y674QTQTNSPRRAR685, homologous to those of neurotoxins from Ophiophagus (cobra) and Bungarus genera, as well as neurotoxin-like regions from three RABV strains
(20) (Fig. 2D). We further noticed that the same segment bears close similarity to the HIV-1 glycoprotein gp120 SAg motif F164 to V174.
https://t.co/EwwJOSa8RK
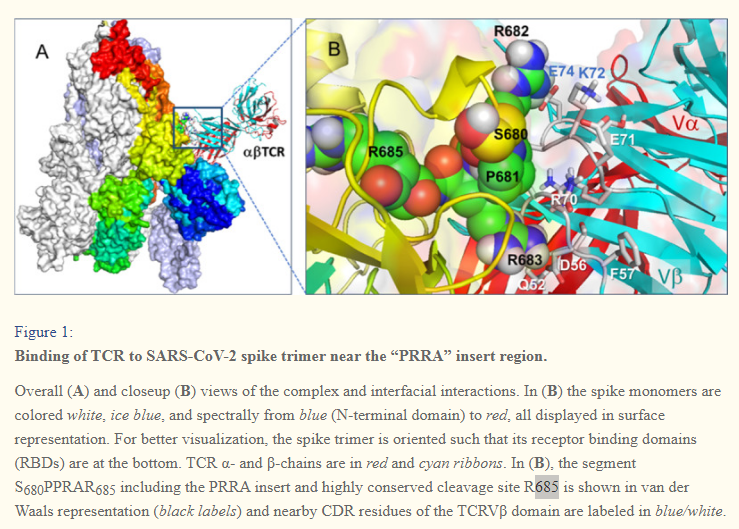
In (B), the segment S680PPRAR685 including the PRRA insert and highly conserved cleavage site *R685* is shown in van der Waals representation (black labels) and nearby CDR residues of the TCRVβ domain are labeled in blue/white
https://t.co/BsY8BAIzDa
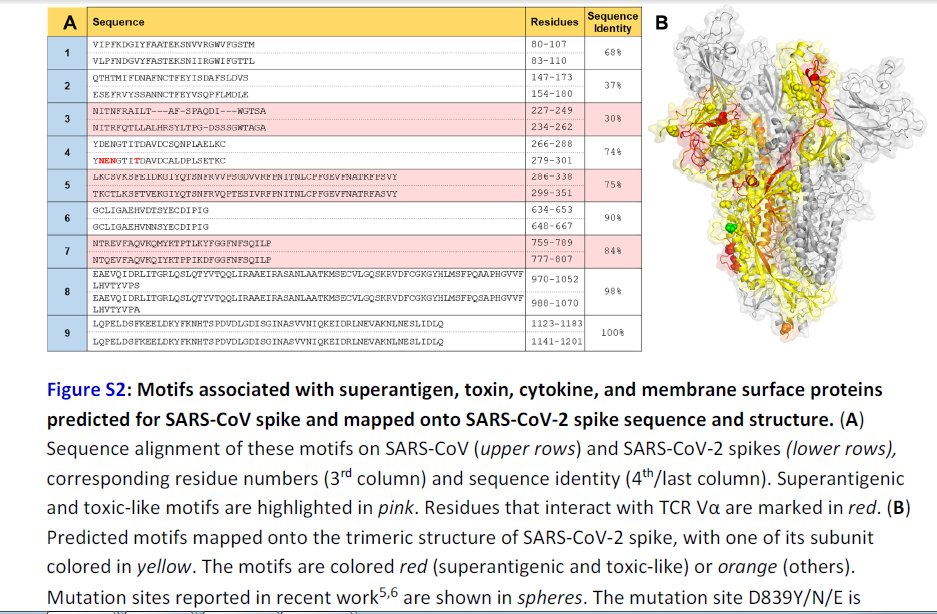
Sequence Identity %
https://t.co/BsY8BAIzDa
Y674 - QTQTNSPRRA - R685
Similar to neurotoxins from Ophiophagus (cobra) & Bungarus genera & neurotoxin-like regions from three RABV strains
T678 - NSPRRA- R685
Superantigenic core, consistently aligned against bacterial or viral SAgs
Further Examination of the Motif near PRRA Reveals Close Structural Similarity to the SEB Superantigen as well as Sequence Similarities to Neurotoxins and a Viral SAg.
The insertion PRRA together with 7 sequentially preceding residues & succeeding R685 (conserved in β-CoVs) form a motif, Y674QTQTNSPRRAR685, homologous to those of neurotoxins from Ophiophagus (cobra) and Bungarus genera, as well as neurotoxin-like regions from three RABV strains
(20) (Fig. 2D). We further noticed that the same segment bears close similarity to the HIV-1 glycoprotein gp120 SAg motif F164 to V174.
https://t.co/EwwJOSa8RK
In (B), the segment S680PPRAR685 including the PRRA insert and highly conserved cleavage site *R685* is shown in van der Waals representation (black labels) and nearby CDR residues of the TCRVβ domain are labeled in blue/white
https://t.co/BsY8BAIzDa
Sequence Identity %
https://t.co/BsY8BAIzDa
Y674 - QTQTNSPRRA - R685
Similar to neurotoxins from Ophiophagus (cobra) & Bungarus genera & neurotoxin-like regions from three RABV strains
T678 - NSPRRA- R685
Superantigenic core, consistently aligned against bacterial or viral SAgs
A THREAD ON @SarangSood
Decoded his way of analysis/logics for everyone to easily understand.
Have covered:
1. Analysis of volatility, how to foresee/signs.
2. Workbook
3. When to sell options
4. Diff category of days
5. How movement of option prices tell us what will happen
1. Keeps following volatility super closely.
Makes 7-8 different strategies to give him a sense of what's going on.
Whichever gives highest profit he trades in.
2. Theta falls when market moves.
Falls where market is headed towards not on our original position.
3. If you're an options seller then sell only when volatility is dropping, there is a high probability of you making the right trade and getting profit as a result
He believes in a market operator, if market mover sells volatility Sarang Sir joins him.
4. Theta decay vs Fall in vega
Sell when Vega is falling rather than for theta decay. You won't be trapped and higher probability of making profit.
Decoded his way of analysis/logics for everyone to easily understand.
Have covered:
1. Analysis of volatility, how to foresee/signs.
2. Workbook
3. When to sell options
4. Diff category of days
5. How movement of option prices tell us what will happen
1. Keeps following volatility super closely.
Makes 7-8 different strategies to give him a sense of what's going on.
Whichever gives highest profit he trades in.
I am quite different from your style. I follow the market's volatility very closely. I have mock positions in 7-8 different strategies which allows me to stay connected. Whichever gives best profit is usually the one i trade in.
— Sarang Sood (@SarangSood) August 13, 2019
2. Theta falls when market moves.
Falls where market is headed towards not on our original position.
Anilji most of the time these days Theta only falls when market moves. So the Theta actually falls where market has moved to, not where our position was in the first place. By shifting we can come close to capturing the Theta fall but not always.
— Sarang Sood (@SarangSood) June 24, 2019
3. If you're an options seller then sell only when volatility is dropping, there is a high probability of you making the right trade and getting profit as a result
He believes in a market operator, if market mover sells volatility Sarang Sir joins him.
This week has been great so far. The main aim is to be in the right side of the volatility, rest the market will reward.
— Sarang Sood (@SarangSood) July 3, 2019
4. Theta decay vs Fall in vega
Sell when Vega is falling rather than for theta decay. You won't be trapped and higher probability of making profit.
There is a difference between theta decay & fall in vega. Decay is certain but there is no guaranteed profit as delta moves can increase cost. Fall in vega on the other hand is backed by a powerful force that sells options and gives handsome returns. Our job is to identify them.
— Sarang Sood (@SarangSood) February 12, 2020

Moderna CEO Stephane Bancel was previously CEO of bioMerieux in France from 07-10.
Alain Merieux, who owns bioMerieux, was instrumental in the creation of the Wuhan Institute of Virology P4 Lab.
The same people who helped create the virus, also helped to create the vaccines...
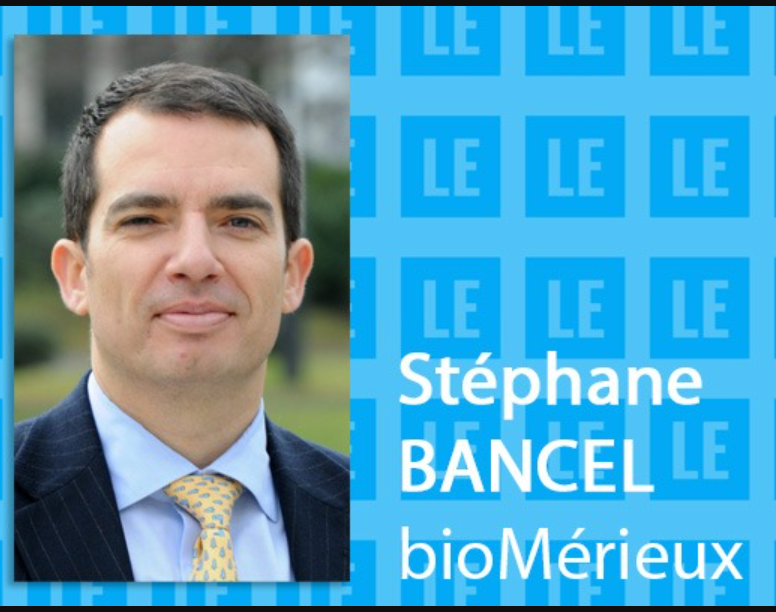
Moderna partnered with French Pasteur Institute in 2015 to develop mRNA vaccine technology.
Pasteur Institute partnered with the Wuhan P4 Laboratory in 2017 along with the Merieux Foundation to study emerging viruses...
https://t.co/yFsHwrNYaK
https://t.co/9M5lydBKhM

Nobel prize winning scientist Luc Montagnier asserts that Sars-Cov-2 is man-made and originated from the Wuhan Institute of Virology.
Montagnier did extensive work with the Pasteur Institute in France which was partnered with the Wuhan P4.
Merieux Foundation & the Chinese government have worked together since 1965, and partnered to study emerging pathogens in Africa in 2015.
Their research included "PATHOGENS CARRIED BY BATS" that provoke respiratory diseases.
🚨🚨🚨
https://t.co/gVwpT0ssqI

Alain Merieux, who owns bioMerieux, was instrumental in the creation of the Wuhan Institute of Virology P4 Lab.
The same people who helped create the virus, also helped to create the vaccines...
Moderna partnered with French Pasteur Institute in 2015 to develop mRNA vaccine technology.
Pasteur Institute partnered with the Wuhan P4 Laboratory in 2017 along with the Merieux Foundation to study emerging viruses...
https://t.co/yFsHwrNYaK
https://t.co/9M5lydBKhM
Nobel prize winning scientist Luc Montagnier asserts that Sars-Cov-2 is man-made and originated from the Wuhan Institute of Virology.
Montagnier did extensive work with the Pasteur Institute in France which was partnered with the Wuhan P4.
Merieux Foundation & the Chinese government have worked together since 1965, and partnered to study emerging pathogens in Africa in 2015.
Their research included "PATHOGENS CARRIED BY BATS" that provoke respiratory diseases.
🚨🚨🚨
https://t.co/gVwpT0ssqI