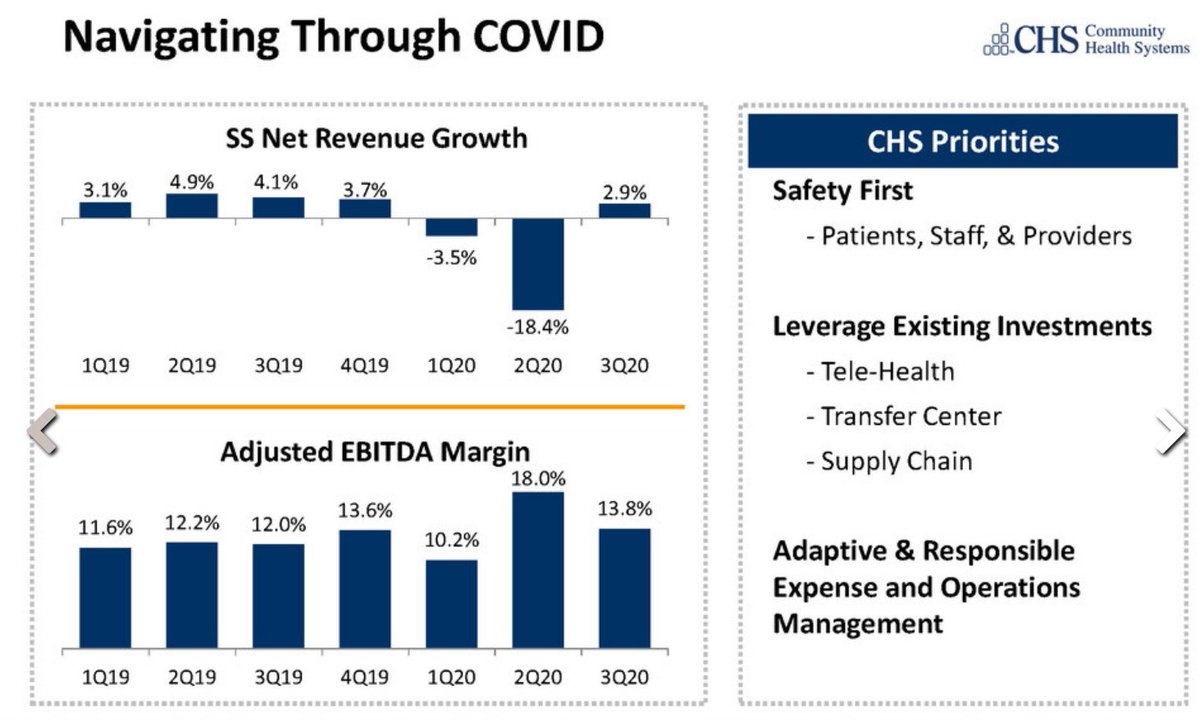
We have, for example, Community Health Systems, which operates 89 hospitals in 16 states, many of them in smaller towns / metro areas.
Through the pandemic, CHS's EBITDA margin never even fell into single digits, and profitability actually *increased* in 2020.
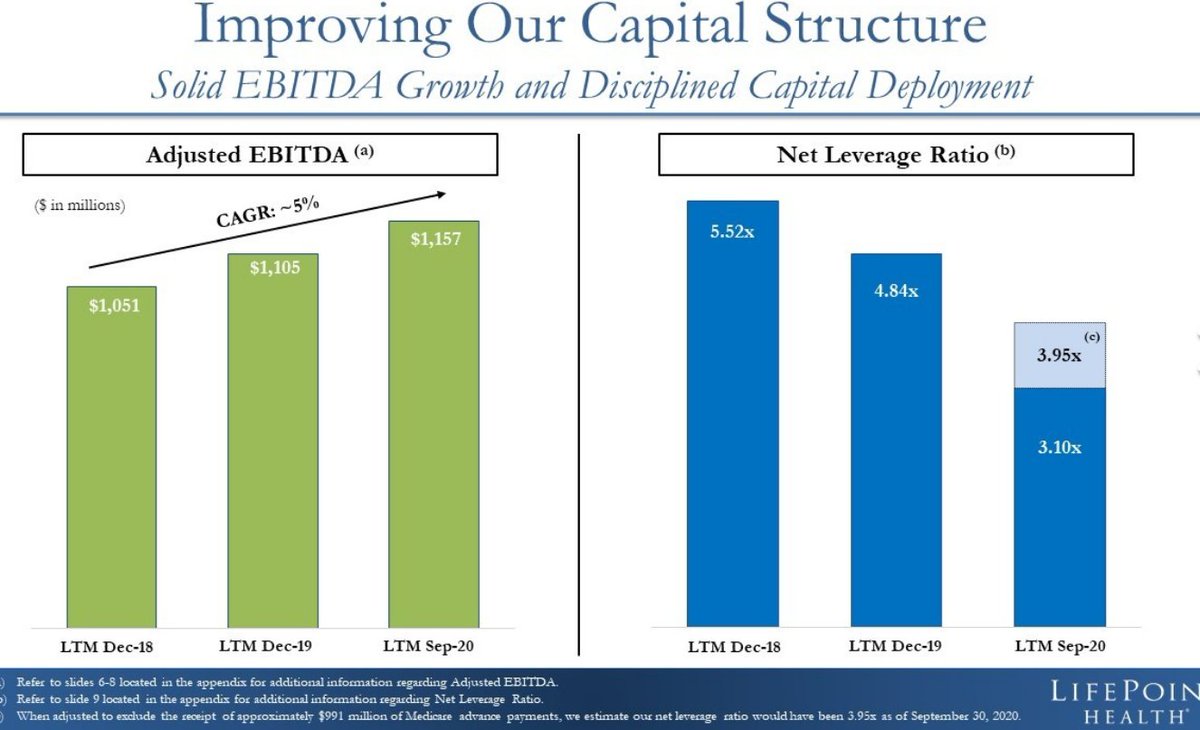
Meanwhile, Lifepoint Health (84 hospitals, 30 states) also saw profits increase in 2020, while its cash-to-debt ratio fell. Pretty solid year.
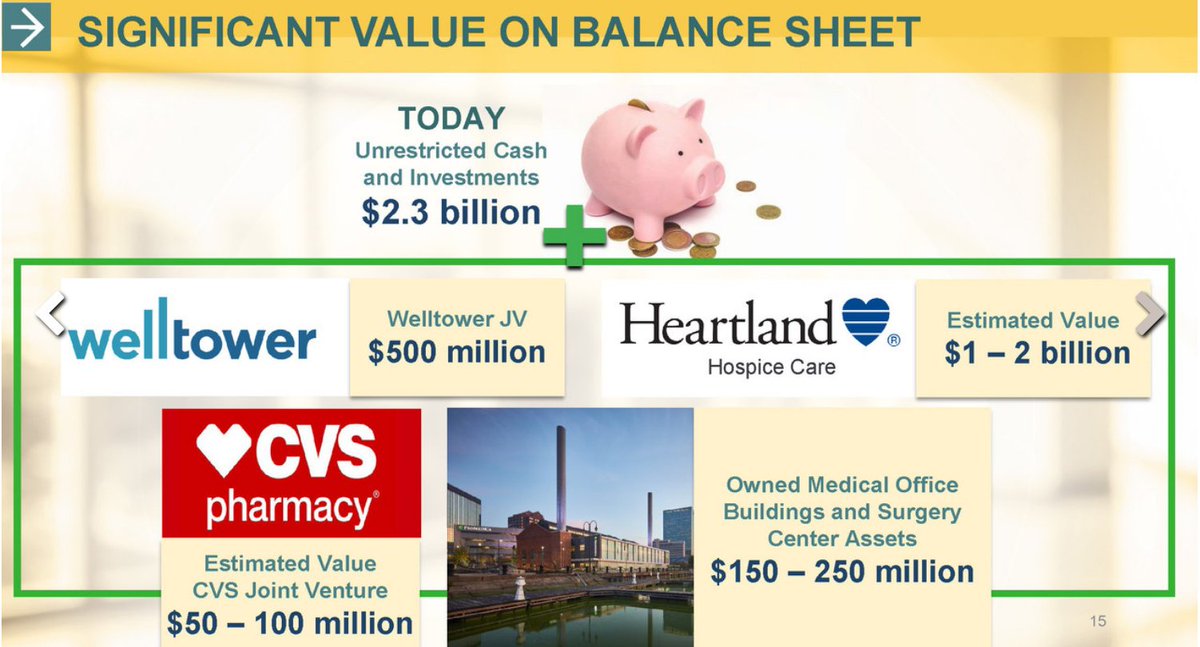
ProMedica Health (non-profit, 13 Midwestern hospitals) actually saw profits increase even in *the first half of 2020,* when hospitals were supposedly facing catastrophe.
They finished the year with ~$440M of EBITDA, and $2.3B of cash on hand.
Baylor Scott & White (52 hospitals) saw its profit margin *more than double* during the pandemic year, and ended September with $7.8 billion of cash and portfolio investments.
That's about $600M more than they had pre-pandemic.
Mass General Brigham's cash pile is now over $11 billion, which is roughly twice what Congress proposes to allocate to all rural hospitals in this proposal.
That number is *up* by ~$2B from the start of the pandemic, which is quite something.
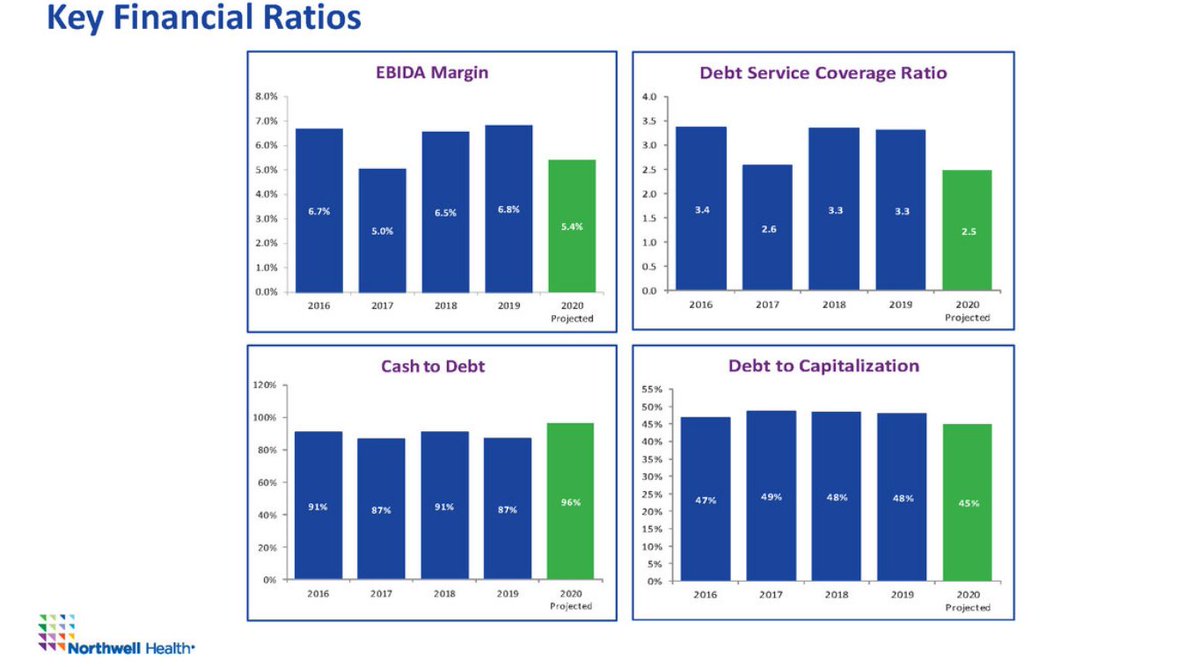
Head down the Atlantic coast to NY, and we find that (non-profit) Northwell Health's EBITDA margin did dip a bit in 2020, but not dramatically.
And, like every other chain in this thread, Northwell ended up with a healthier balance sheet than at the beginning of the crisis.
If we turn back to the Midwest, we might look to OhioHealth, a highly profitable "not-for-profit" with 12 hospitals.
Not clear why they need $6.2 billion of cash on hand (4x their total debt), but they have it, which must be nice.
While we're in the neighborhood, we may want to look north, toward Michigan, home to Henry Ford (5 hospitals) and Spectrum Health (14 hospitals).
And...yup! Cash upon cash. Spectrum's cash pile increased by a quarter (~$1B) in the year to September.
Why?
We could also take a look around Illinois, Missouri, Oklahoma and Wisconsin, perhaps through the lens of SSM Health's 23 hospitals in those states.
SSM enjoyed revenue growth in 2020, and currently sits on a tidy pile of $4.4 billion.
Let's keep heading west. We'll make a stop in Utah, where local giant Intermountain is giving Mass General a run for its money. As a...portfolio manager.
Another hospital chain, with $11B of cash on hand, and a nice healthy profit margin.
And now, to the Pacific Coast. Providence is a good example - 51 hospitals from California to Alaska, along with a few facilities in MT, NM and TX.
EBITDA margins were down a smidge, but cash was up by $2B to an eye-popping $14.5B.
Is that a lot? It seems like a lot.
We can keep going, though I am not sure we need to.
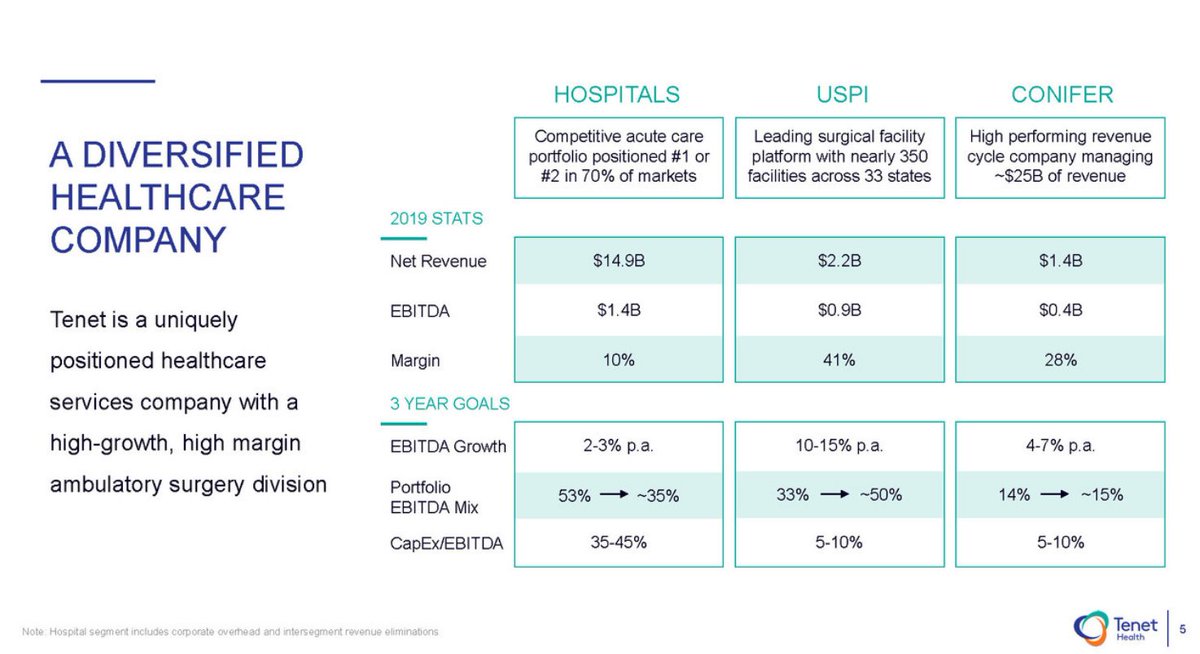
There's Tenet, with its 40% EBITDA margin on surgical facilities. Or UHS, where free cash flow more than doubled in 2020...
But, at this point, I think the picture is clear. Congress is wasting your money. /n