
For Shorting like my Dixon short trade -Find stocks that have negative monthly price cycle & turning into EMA 10/20 on weekly
From there you can get low risk entry point & good R:R
Just need 1-2 good short trade for a 3% monthly gain. Extreme patience to wait for best time
More from EquiAlpha -MidTerm Momentum🐎🐎
The other way to look at this is that..The stock went below 21 month EA in 2008 & 2020 crash
Something is happening really too bad and worst is yet to come for entire market !!
Something is happening really too bad and worst is yet to come for entire market !!
HDFC bank Monthly Chart :
— EquiAlpha -MidTerm Momentum\U0001f40e\U0001f40e (@equialpha) March 7, 2022
In last 20 years - Only 2 times the stock has gone below 21 month EMA as market. This seems the third time (Monthly close will confirm )
Don't know but something seems off !!
Lets check again on month end pic.twitter.com/9eeVfikdnU


3 Ways to ride a stock 🐎
(a thread) 🧵
>Do retweet if it adds value as this took a long time for me to make
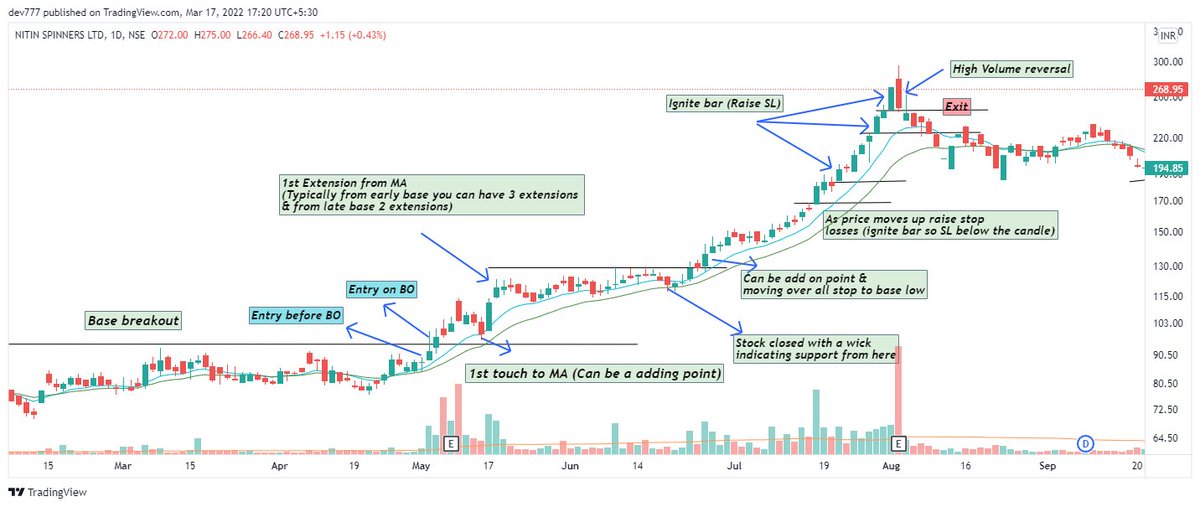
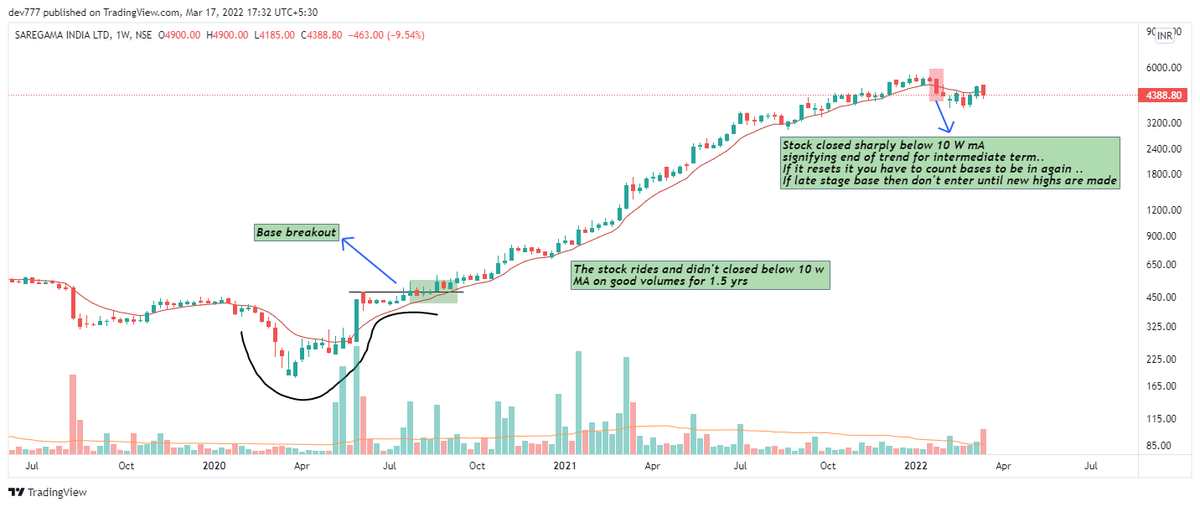
1) 10/20 Day EMA -
Enter the stock as it comes up back to the 10/20 day EMA and ride it till it drops below or SL hits as explained below
Eg -Nitin Spinners as below
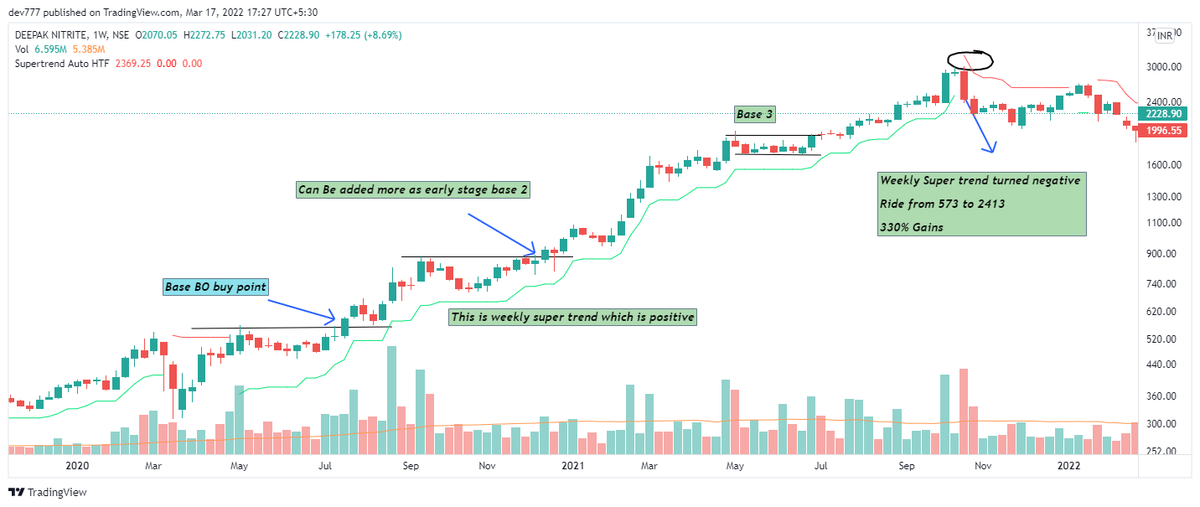
2) Weekly Super trend (Setting 2,7): Whenever trend changes , volatility increases & supertrend measures volatility..That's the logic behind it
Eg - Deepak Nitrite
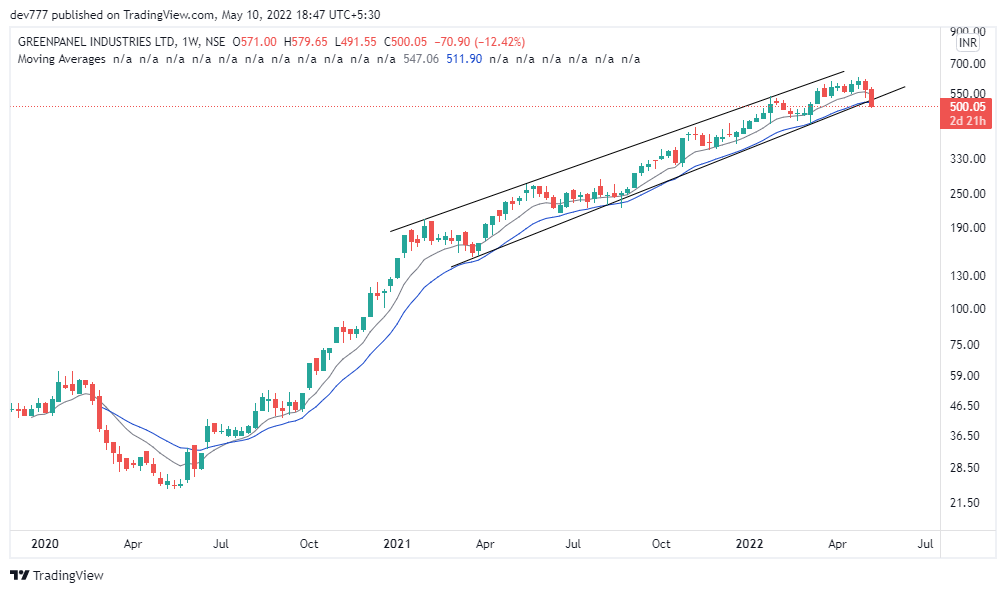
3) 10 Week MA : Trend following can be done using 10 w MA
Eg - Saregama
Fundamental analysis has to be done for best results as these are to be applied on a growing co + sector movt together ..Eg If you will apply to random co with low RS or low growth..This might be very choppy
Do retweet if make sense so as I can make more of such thread
Join telegram group for stock analysis & daily updates
https://t.co/lJ00OKEVd2
Download equialpha app for free momentum basics course
https://t.co/9N7vFDorC8
Thanks for reading.. Do like
(a thread) 🧵
>Do retweet if it adds value as this took a long time for me to make
1) 10/20 Day EMA -
Enter the stock as it comes up back to the 10/20 day EMA and ride it till it drops below or SL hits as explained below
Eg -Nitin Spinners as below
2) Weekly Super trend (Setting 2,7): Whenever trend changes , volatility increases & supertrend measures volatility..That's the logic behind it
Eg - Deepak Nitrite
3) 10 Week MA : Trend following can be done using 10 w MA
Eg - Saregama
Fundamental analysis has to be done for best results as these are to be applied on a growing co + sector movt together ..Eg If you will apply to random co with low RS or low growth..This might be very choppy
Do retweet if make sense so as I can make more of such thread
Join telegram group for stock analysis & daily updates
https://t.co/lJ00OKEVd2
Download equialpha app for free momentum basics course
https://t.co/9N7vFDorC8
Thanks for reading.. Do like
More from Screeners


On the occasion of youtube 20k and Twitter 70k members
A small tribute/gift to members
Screeners
technical screeners - intraday and positional both
before proceeding - i have helped you , can i ask you so that it can help someone else too
thank you
positional one
run - find #stock - draw chart - find levels
1- Stocks closing daily 2% up from 5 days
https://t.co/gTZrYY3Nht
2- Weekly breakout
https://t.co/1f4ahEolYB
3- Breakouts in short term
https://t.co/BI4h0CdgO2
4- Bullish from last 5
intraday screeners
5- 15 minute Stock Breakouts
https://t.co/9eAo82iuNv
6- Intraday Buying seen in the past 15 minutes
https://t.co/XqAJKhLB5G
7- Stocks trading near day's high on 5 min chart with volume BO intraday
https://t.co/flHmm6QXmo
Thank you


You May Also Like


So friends here is the thread on the recommended pathway for new entrants in the stock market.
Here I will share what I believe are essentials for anybody who is interested in stock markets and the resources to learn them, its from my experience and by no means exhaustive..
First the very basic : The Dow theory, Everybody must have basic understanding of it and must learn to observe High Highs, Higher Lows, Lower Highs and Lowers lows on charts and their
Even those who are more inclined towards fundamental side can also benefit from Dow theory, as it can hint start & end of Bull/Bear runs thereby indication entry and exits.

Next basic is Wyckoff's Theory. It tells how accumulation and distribution happens with regularity and how the market actually
Dow theory is old but
Here I will share what I believe are essentials for anybody who is interested in stock markets and the resources to learn them, its from my experience and by no means exhaustive..
First the very basic : The Dow theory, Everybody must have basic understanding of it and must learn to observe High Highs, Higher Lows, Lower Highs and Lowers lows on charts and their
Even those who are more inclined towards fundamental side can also benefit from Dow theory, as it can hint start & end of Bull/Bear runs thereby indication entry and exits.
Next basic is Wyckoff's Theory. It tells how accumulation and distribution happens with regularity and how the market actually
Dow theory is old but
Old is Gold....
— Professor (@DillikiBiili) January 23, 2020
this Bharti Airtel chart is a true copy of the Wyckoff Pattern propounded in 1931....... pic.twitter.com/tQ1PNebq7d