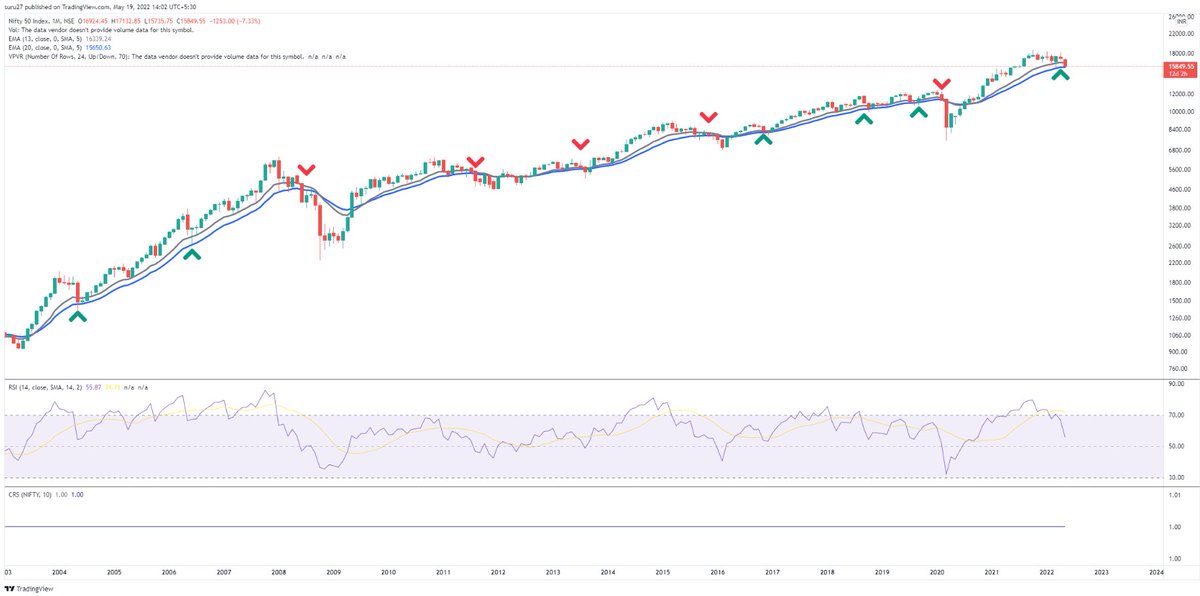
#NIFTY Blueline is 20M EMA. One of key support in uptrend. From Sept'18 (peak) and Feb'16 (bottom), current NIFTY CAGR: 8.7% and 14.8%. Same in Oct'21, 16% and 21%. If stays at these levels for 1 year, 4.5 year CAGR will be 6.7%. Something to chew on reversion to mean
More from kumar saurabh
If you are in the market taking direct exposure in stocks for long term investing, you at least need to learn
1. Basics of Finance
2. Basics of Valuation
3. Basics of Fraud
Else you are putting your hard earned money on fire. Enough books and free resources available.
Wrote this thread for the same leveraging one of my Youtube videos as friends wanted to know where to
1. Basics of Finance
2. Basics of Valuation
3. Basics of Fraud
Else you are putting your hard earned money on fire. Enough books and free resources available.
Wrote this thread for the same leveraging one of my Youtube videos as friends wanted to know where to
Few friends are asking for list of books to learn investing topics. Have covered from my side a year back in this Youtube videohttps://t.co/bUb2S3eAVm
— kumar saurabh (@suru27) May 12, 2022
Will break down into parts what needs to be read at least as a pure fundamental investor in this thread
More from Screeners


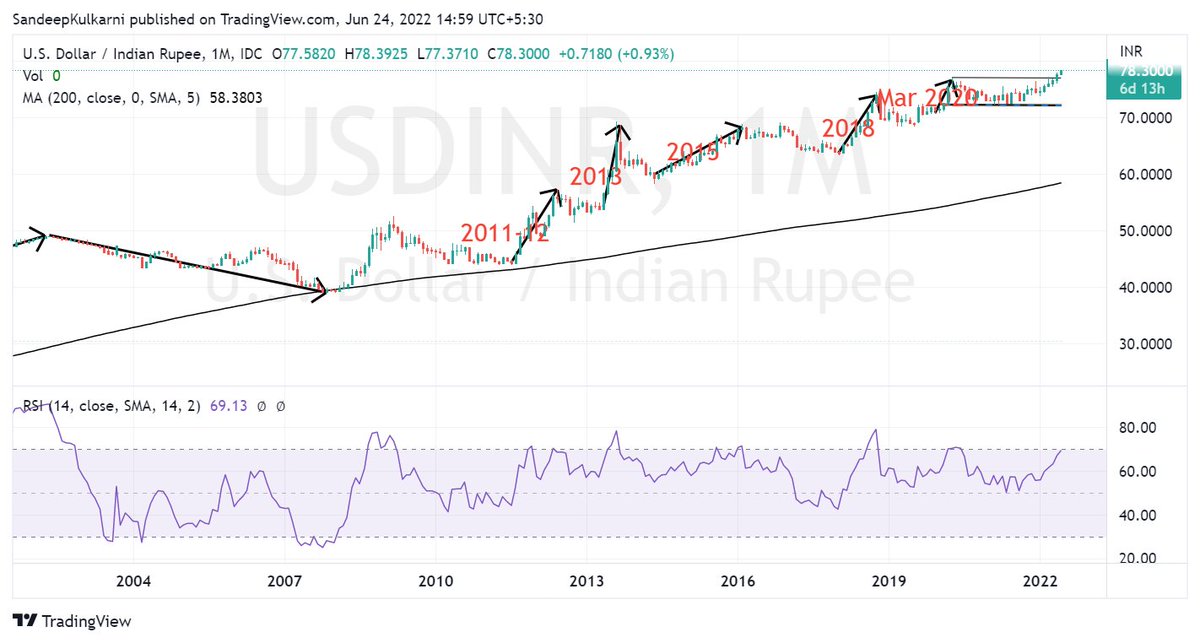
History tells us when #USDINR moves it moves a lot. In that context it has been remarkably resilient with just 8% depreciation. It looks like we are very close to the point from where Rupee will start to appreciating again.
BTW Nifty Metal has inverse correlation with USDINR. https://t.co/X6cqVcYF3V
BTW Nifty Metal has inverse correlation with USDINR. https://t.co/X6cqVcYF3V
We know how our stock market has weathered the FII selling.
— Sandeep Kulkarni (@moneyworks4u_fa) June 10, 2022
But the equally big story is how Rupee has weathered $50bn+ outflows since Oct 2021. Hats off to RBI Governor Das & his team for having the vision of building huge reserves in his tenure. pic.twitter.com/CVuF9dM361