On a day which gives huge gap at day open, mean reversion strategies works better than trend following/momentum strategies.
Those who are good at pullback trading can easily adapt to reversion and take advantage of current market conditions
More from Aneesh Philomina Antony (ProdigalTrader)
3147 to 3270
minor resustnce breakout now https://t.co/mcLJB7yEhO
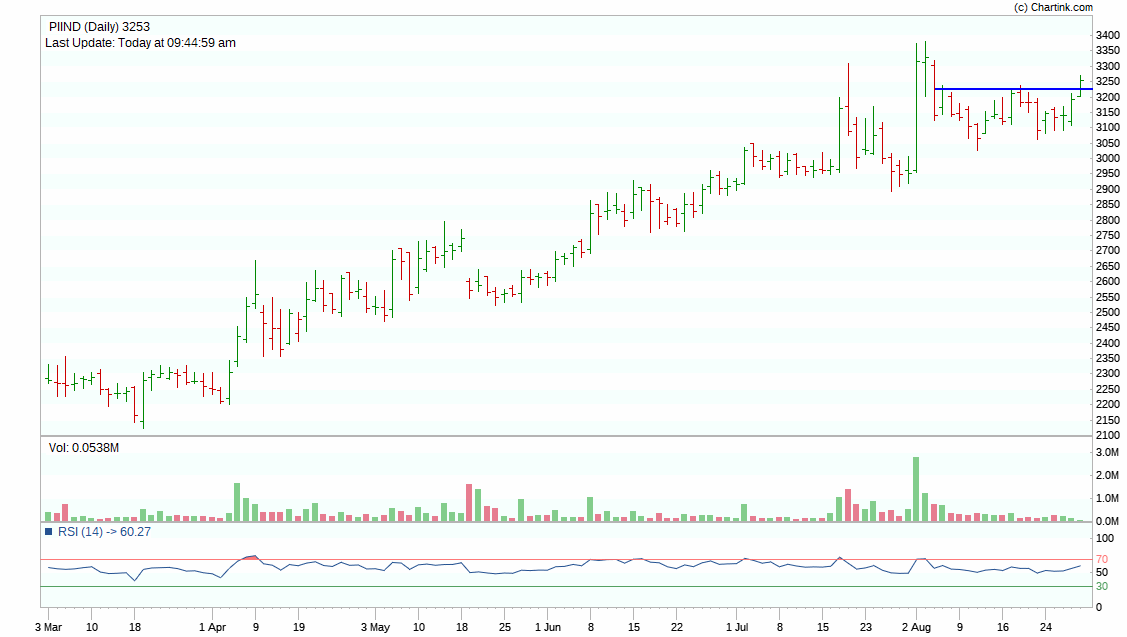
#piind
— ProdigalTrader (@ProdigalTrader) August 24, 2021
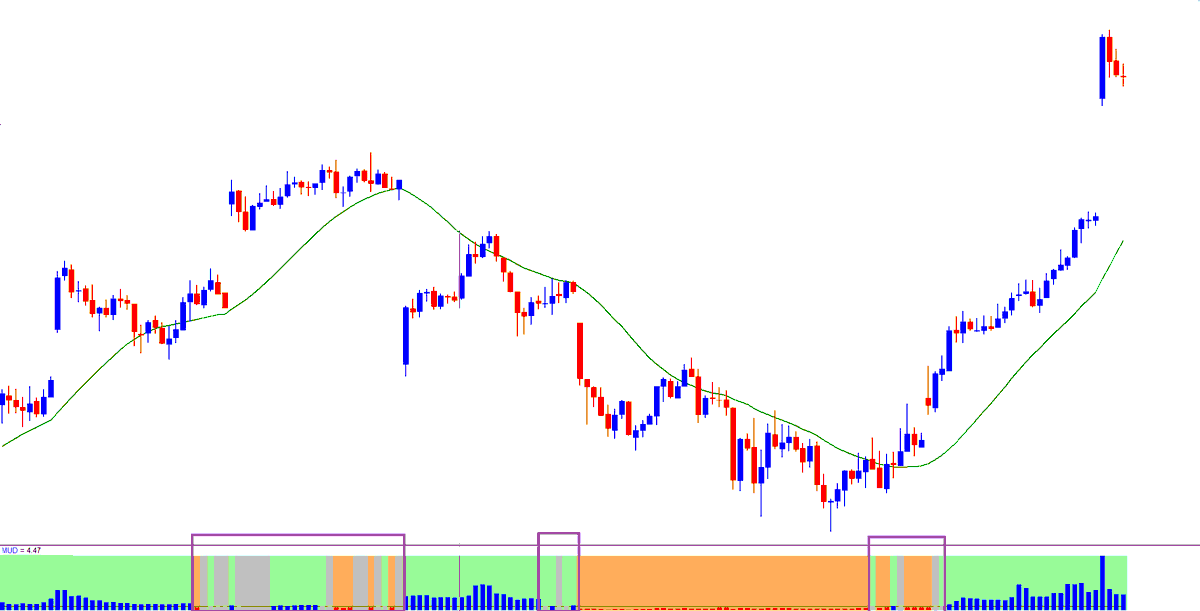
price at the bottom of a bullish channel with RSI showing clue son potetntial reversal here. Volume is dried up in pullback showing lack of supply#StockMarket #StocksInFocus #stocktrading #stockselection #stocktowatch pic.twitter.com/jpDOpnCzFu
More from Screeners

Do Share the above tweet 👆
These are going to be very simple yet effective pure price action based scanners, no fancy indicators nothing - hope you liked it.
https://t.co/JU0MJIbpRV
52 Week High
One of the classic scanners very you will get strong stocks to Bet on.
https://t.co/V69th0jwBr
Hourly Breakout
This scanner will give you short term bet breakouts like hourly or 2Hr breakout
Volume shocker
Volume spurt in a stock with massive X times


What does it mean?
7 tweets that will teach you about its basics (and much more):🧵
Collaborated with @niki_poojary
1/ What is CPR?
The basics of CPR, how it's calculated, and TC and BC in CPR.
User: @ZerodhaVarsity.
One can also gauge the trend whether bullish or bearish.
Explained in very simple words
@ZerodhaVarsity 2/ What are the Uses of CPR?
User: @YMehta_
A thread that provides examples along with the concept.
Also includes an Intraday Trading Setup on 5 min
#CPR is an indicator which is used for #Intraday in Stock Market.
— Yash Mehta (@YMehta_) November 19, 2021
This learning thread would be on
"\U0001d650\U0001d668\U0001d65a\U0001d668 \U0001d664\U0001d65b \U0001d63e\U0001d64b\U0001d64d"
Like\u2764\ufe0f& Retweet\U0001f501for wider reach and for more such learning thread in the future.
Also, an investment strategy is shared using CPR in the end.
1/24
@ZerodhaVarsity @YMehta_ 3/ How to analyze trends with CPR?
User: @cprbykgs
How to interpret CPR based on the candles forming either above or below the daily and weekly CPR.
He is the most famous guy when it comes to CPR, so go through his Twitter and Youtube
CPR indicator trend analysis:
— Gomathi Shankar (@cprbykgs) January 25, 2022
Candles below daily & weekly CPR \U0001f43b
Candles above daily CPR but below weekly CPR early confirmation of \U0001f402
Candles above daily + weekly CPR strong confirmation of \U0001f402
Isn\u2019t it simple?#cprbykgs #cprindicator #nifty #banknifty
@ZerodhaVarsity @YMehta_ @cprbykgs 4/ Interpreting longer timeframes with CPR
User: @cprbykgs
Trend Reversals with CPR when the trend is bullish and it enters the daily CPR
#banknifty
— Gomathi Shankar (@cprbykgs) July 9, 2021
Candles above monthly CPR- Bullish
Candles above weekly CPR- Bullish
Now, whenever candles enter daily CPR range it indicates weakness of current trend & early signs of trend reversal.
So, wait for the candles to exit the daily CPR range then take the trade. (1/4) pic.twitter.com/7vaaLMCrV8

For new followers ...
If u r a pivot based intraday trader, u should have this cheat sheet. Follow this and C. Your wrong trades will reduce considerably. Good luck.
#FREETIPS
— ScorpioManoj (@scorpiomanojFRM) April 1, 2022
Pivot Rules snapshot
A free one page cheat sheet for pivot based trading that could probably be sold for a hefty price ....
Rem: This is just a broad set of rules. There are many advance rules more than this. pic.twitter.com/FnzmGGKx0P
You May Also Like

Flat Earth conference attendees explain how they have been brainwashed by YouTube and Infowarshttps://t.co/gqZwGXPOoc
— Raw Story (@RawStory) November 18, 2018
This spring at SxSW, @SusanWojcicki promised "Wikipedia snippets" on debated videos. But they didn't put them on flat earth videos, and instead @YouTube is promoting merchandising such as "NASA lies - Never Trust a Snake". 2/

A few example of flat earth videos that were promoted by YouTube #today:
https://t.co/TumQiX2tlj 3/
https://t.co/uAORIJ5BYX 4/
https://t.co/yOGZ0pLfHG 5/


A small tribute/gift to members
Screeners
technical screeners - intraday and positional both
before proceeding - i have helped you , can i ask you so that it can help someone else too
thank you
positional one
run - find #stock - draw chart - find levels
1- Stocks closing daily 2% up from 5 days
https://t.co/gTZrYY3Nht
2- Weekly breakout
https://t.co/1f4ahEolYB
3- Breakouts in short term
https://t.co/BI4h0CdgO2
4- Bullish from last 5
intraday screeners
5- 15 minute Stock Breakouts
https://t.co/9eAo82iuNv
6- Intraday Buying seen in the past 15 minutes
https://t.co/XqAJKhLB5G
7- Stocks trading near day's high on 5 min chart with volume BO intraday
https://t.co/flHmm6QXmo
Thank you