
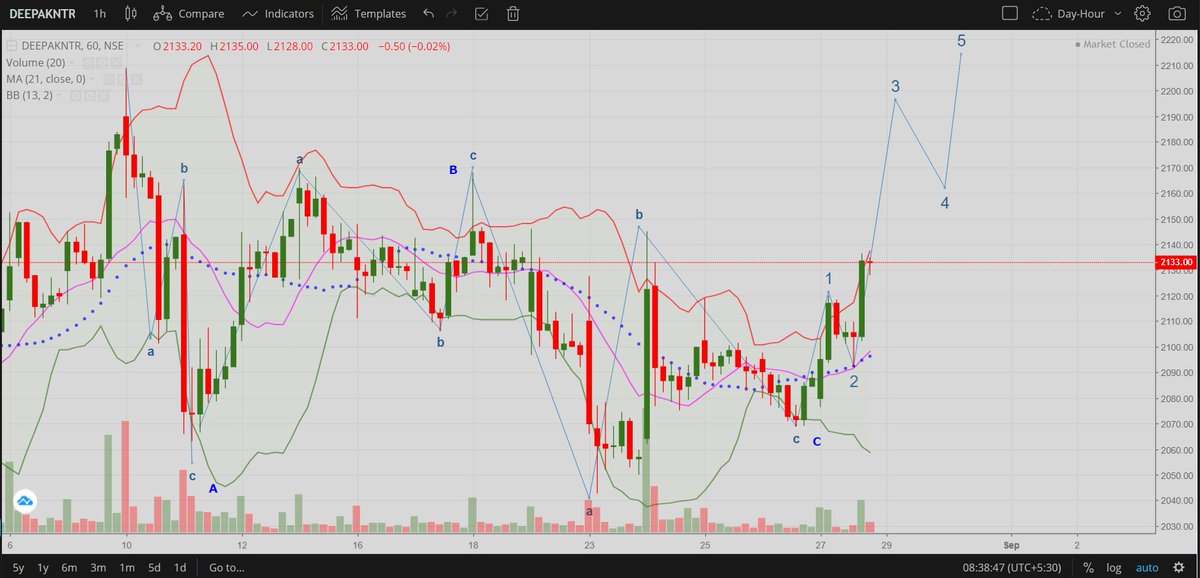
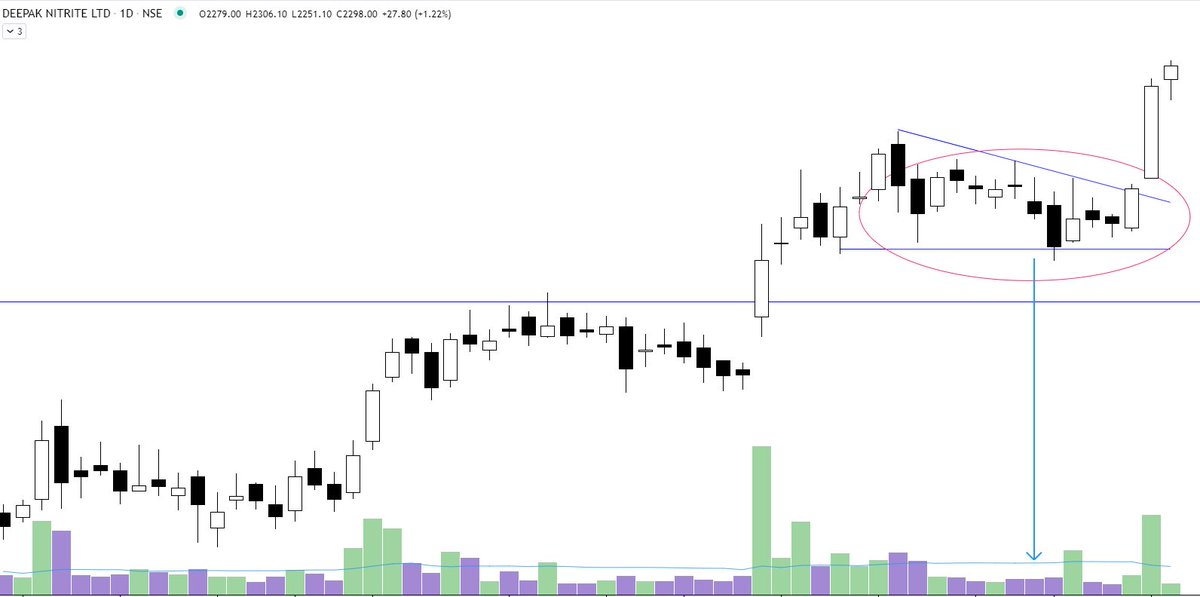
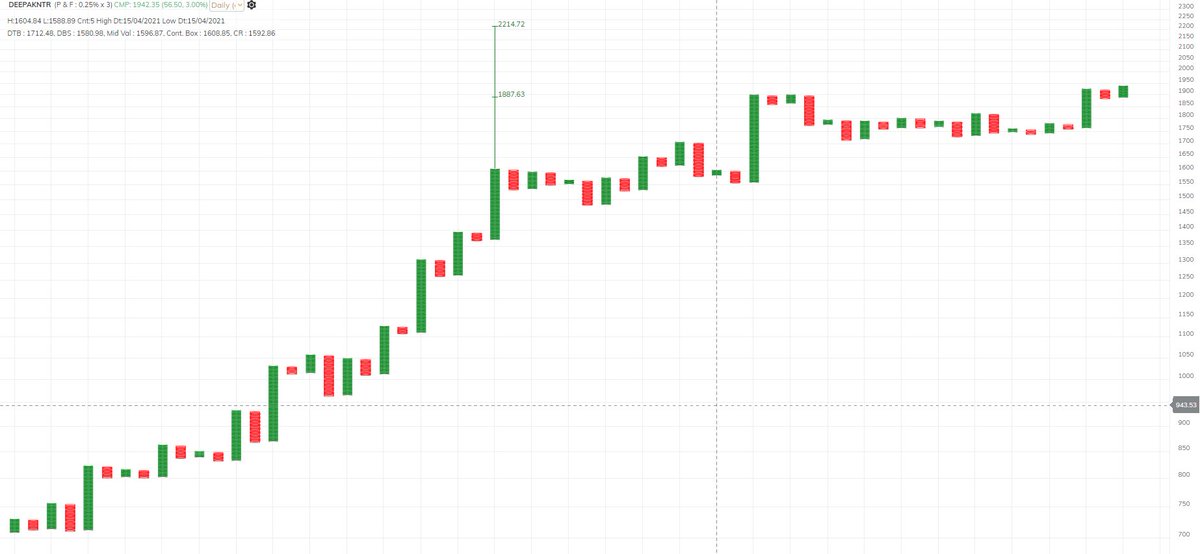
#deepakntr (CMP:2133)
A LRHR trade
"ABC" correction seems to be over.
Holding 2110-2115, likely to head to 2200-2220 in a day or two.
More from Van Ilango (JustNifty)

More from Deepaknitrate

Explained you same concept with Elxsi. The real test of a strong Breakout is that the big hand will not give you another chance to buy the share at the breakout level. They will absorb all the selling of weak hands. I mean "STRONG breakout". https://t.co/7fxFqGQl3p
Tata Elxsi ---
— Steve Nison (@nison_steve) June 30, 2021
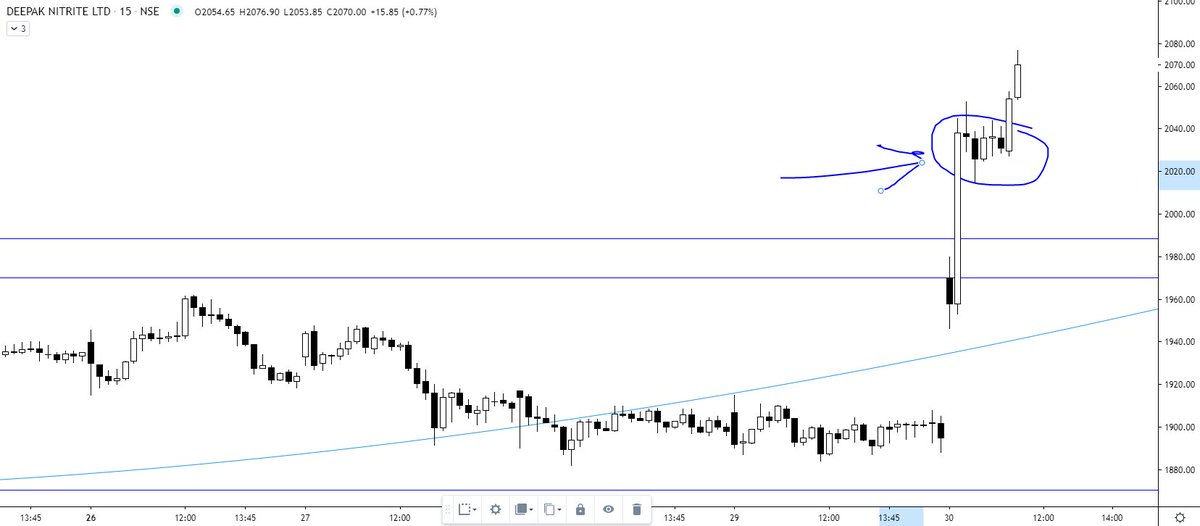
In the last 10 minutes, all the selling was absorbed despite intraday positions being squared off (if not converted). will wait for the EOD data. However, the chart structure is extremely strong. https://t.co/pci7GCDBEO pic.twitter.com/1NBD9V3mKc
Understand the concept - whenever you see price squeeze with volume contraction of this level, you will not get another chance to buy the stock at pullback. The character of a strong BO is that retailers won't be able to buy it. https://t.co/2Qq4pilmd8
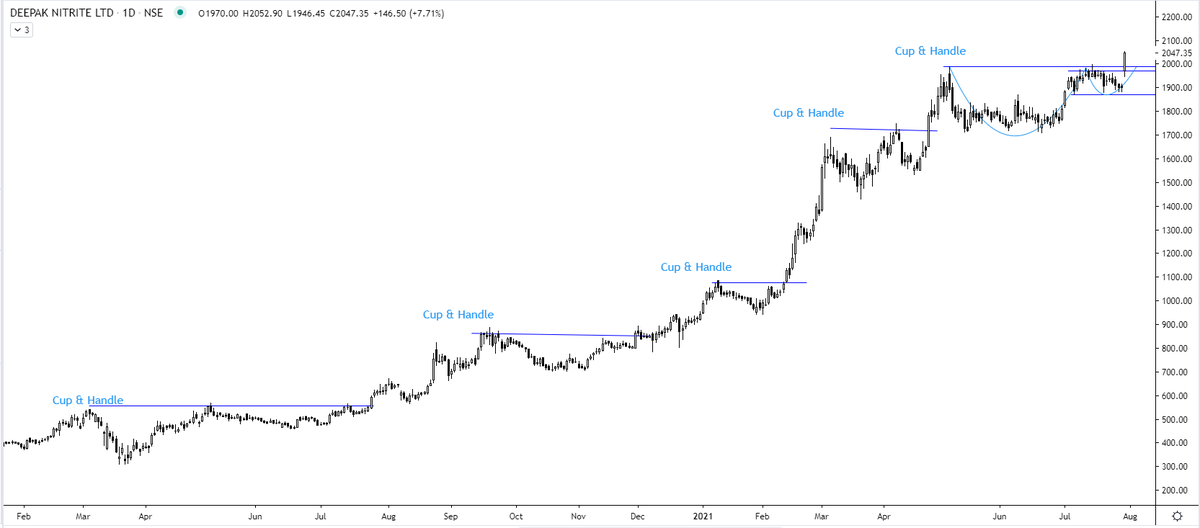
Deepak nitrite
— The_Chartist \U0001f4c8 (@nison_steve) July 30, 2021
Explained you same concept with Elxsi. The real test of a strong Breakout is that the big hand will not give you another chance to buy the share at the breakout level. They will absorb all the selling of weak hands. I mean "STRONG breakout". https://t.co/7fxFqGQl3p pic.twitter.com/hwYIoRxazl


You May Also Like


As a dean of a major academic institution, I could not have said this. But I will now. Requiring such statements in applications for appointments and promotions is an affront to academic freedom, and diminishes the true value of diversity, equity of inclusion by trivializing it. https://t.co/NfcI5VLODi
— Jeffrey Flier (@jflier) November 10, 2018
We know that elite institutions like the one Flier was in (partial) charge of rely on irrelevant status markers like private school education, whiteness, legacy, and ability to charm an old white guy at an interview.
Harvard's discriminatory policies are becoming increasingly well known, across the political spectrum (see, e.g., the recent lawsuit on discrimination against East Asian applications.)
It's refreshing to hear a senior administrator admits to personally opposing policies that attempt to remedy these basic flaws. These are flaws that harm his institution's ability to do cutting-edge research and to serve the public.
Harvard is being eclipsed by institutions that have different ideas about how to run a 21st Century institution. Stanford, for one; the UC system; the "public Ivys".