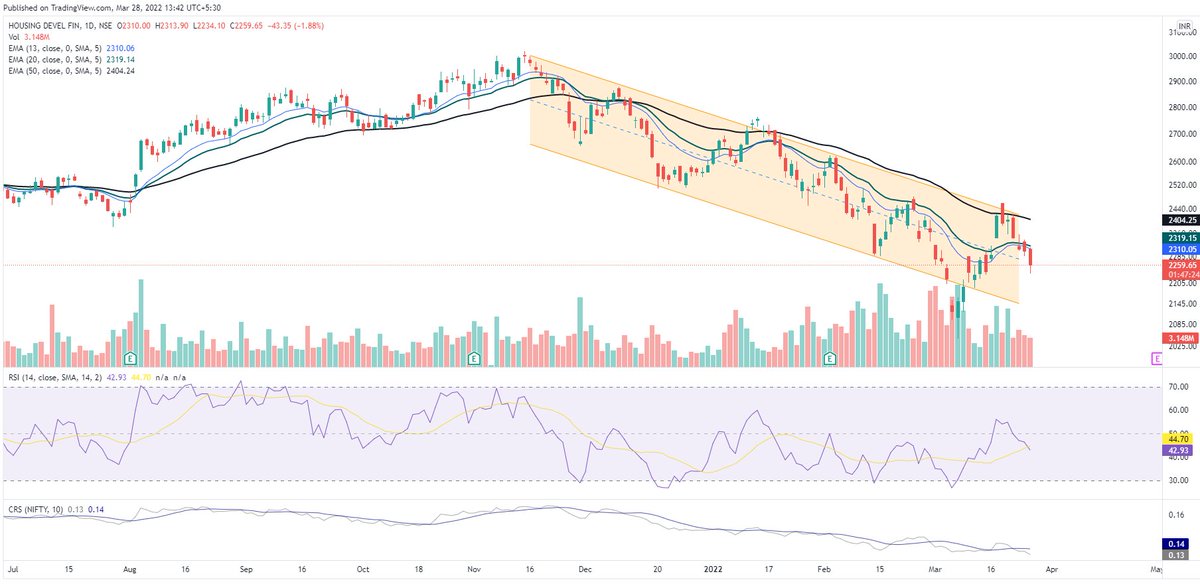
One of biggest insight I can give to long term investors - Never never invest in stock where monthly RSI14 is <50, stock attempts to cross it but stays below it. Have seen enough charts to conclude. Probabilities wont be in favor and can see multi year time correction
More from kumar saurabh
#AR2021 This will be master thread for all annual reports to be covered for 2021
#No 1 #Shreedigvijaycement
#No 2 #Bajajconsumer
#No 1 #Shreedigvijaycement
#AR2021 #Shreedigvijay cement. Started this year annual report reading with Digvijay cement. First time read a cement company AR. Some interesting comments on overall economy. Watch it herehttps://t.co/AQM2snbcHG pic.twitter.com/JL4lx26LlC
— kumar saurabh (@suru27) June 1, 2021
#No 2 #Bajajconsumer
#AR2021 #Bajajconsumer. 2nd company. Highlights - Rs 30 cr cost cutting sustainable ? Who gets Rs 8-9 Cr royalty benefit ? Who owns brand ? Why infra subsidiary with losses, intangible asset complexity ? Industry grown fat 2% in volume n 8% in value at 10 yr cagr pic.twitter.com/W4C0H2h8aV
— kumar saurabh (@suru27) June 7, 2021
Stocks don't pick you, You pick stocks. It's all about process.
At scientific investing, we ve "ghoomega" strategy n currently 4 stocks. UFO was one example shared
The least to do is observe all charts of @VVVStockAnalyst @charts_zone @Accuracy_Invst n u will get their pattern
At scientific investing, we ve "ghoomega" strategy n currently 4 stocks. UFO was one example shared
The least to do is observe all charts of @VVVStockAnalyst @charts_zone @Accuracy_Invst n u will get their pattern
Many were telling me that's stocks move after my post
— Volatility Volume and Value (@VVVStockAnalyst) April 18, 2022
Didn't post nahar cap today when I bought and now it's 10% higher
This shows we surf the move and don't make the move \u270c\ufe0f
More from Screeners





You May Also Like

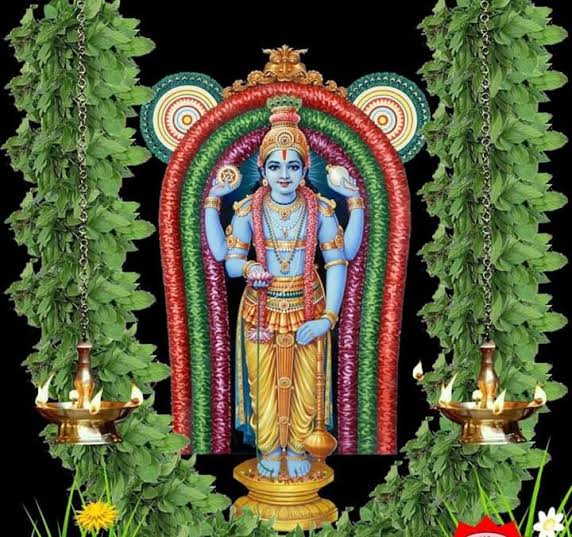
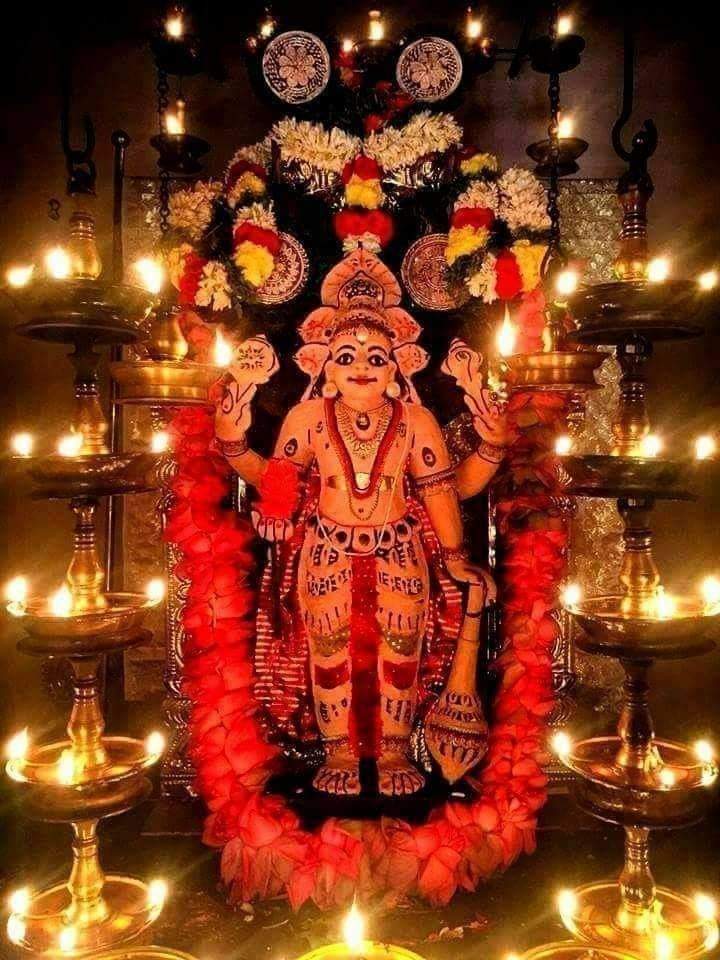
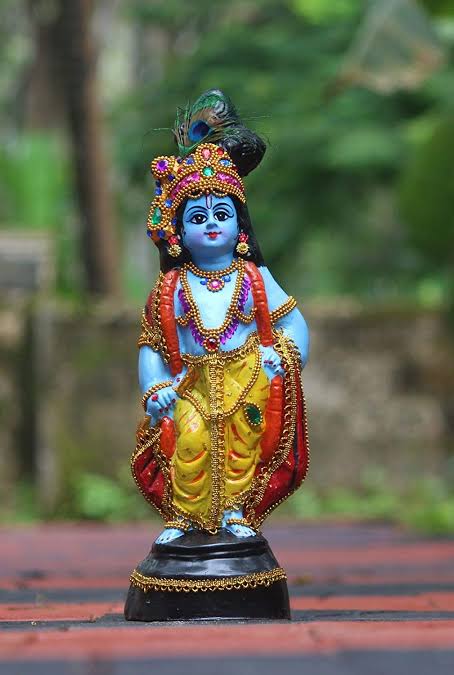
🌿𝑻𝒉𝒆 𝒔𝒕𝒐𝒓𝒚 𝒐𝒇 𝒂 𝑺𝒕𝒂𝒓 : 𝑫𝒉𝒓𝒖𝒗𝒂 & 𝑽𝒊𝒔𝒉𝒏𝒖
Once upon a time there was a Raja named Uttānapāda born of Svayambhuva Manu,1st man on earth.He had 2 beautiful wives - Suniti & Suruchi & two sons were born of them Dhruva & Uttama respectively.
#talesofkrishna https://t.co/E85MTPkF9W
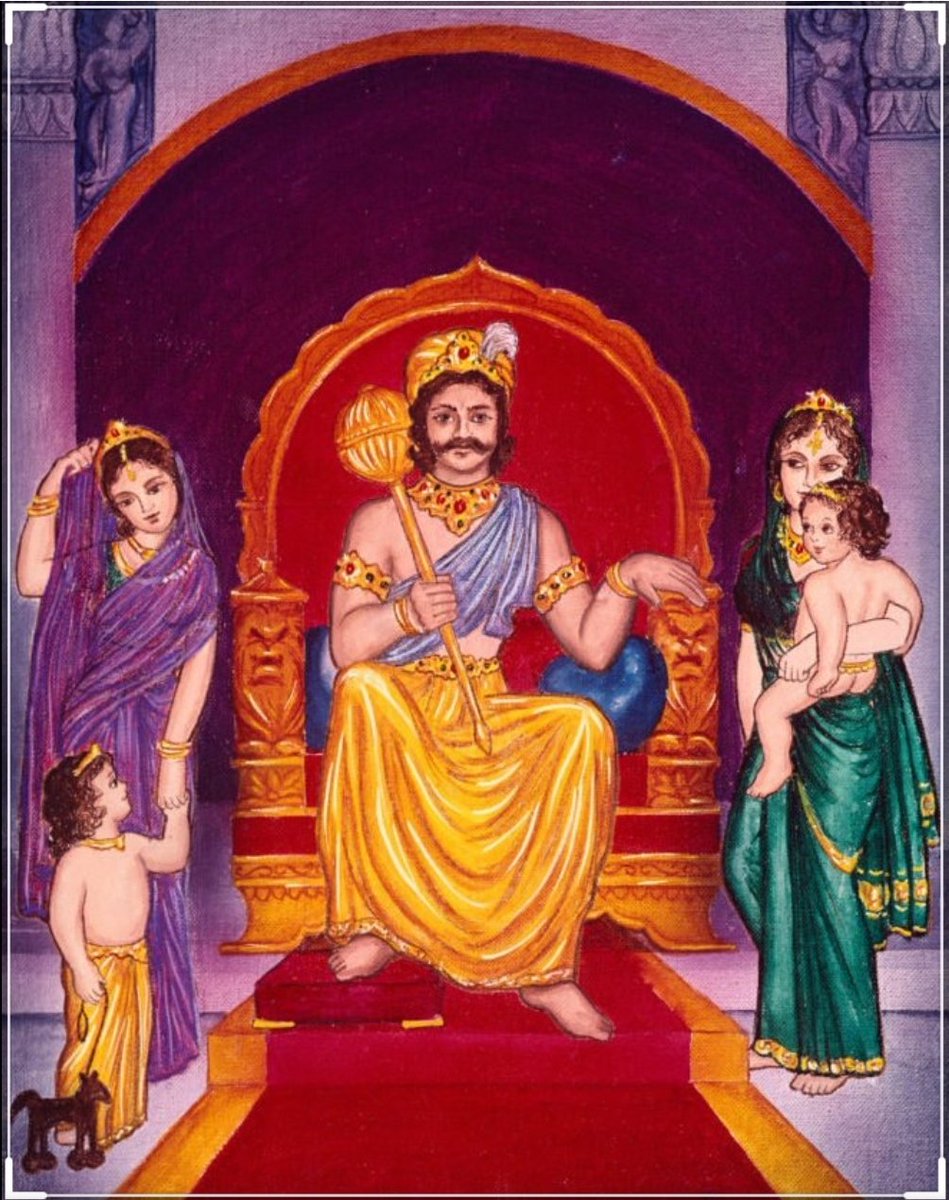
Now Suniti was the daughter of a tribal chief while Suruchi was the daughter of a rich king. Hence Suruchi was always favored the most by Raja while Suniti was ignored. But while Suniti was gentle & kind hearted by nature Suruchi was venomous inside.
#KrishnaLeela
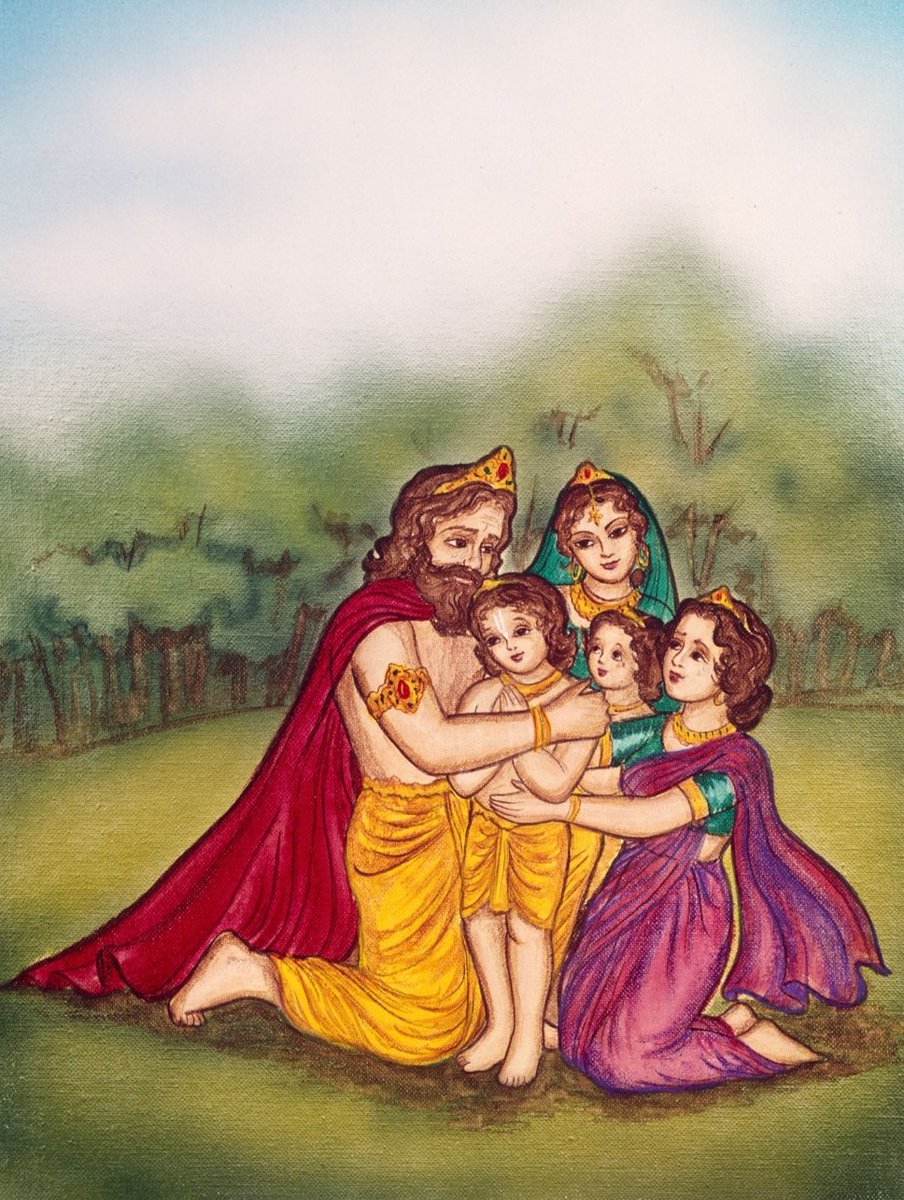
The story is of a time when ideally the eldest son of the king becomes the heir to the throne. Hence the sinhasan of the Raja belonged to Dhruva.This is why Suruchi who was the 2nd wife nourished poison in her heart for Dhruva as she knew her son will never get the throne.
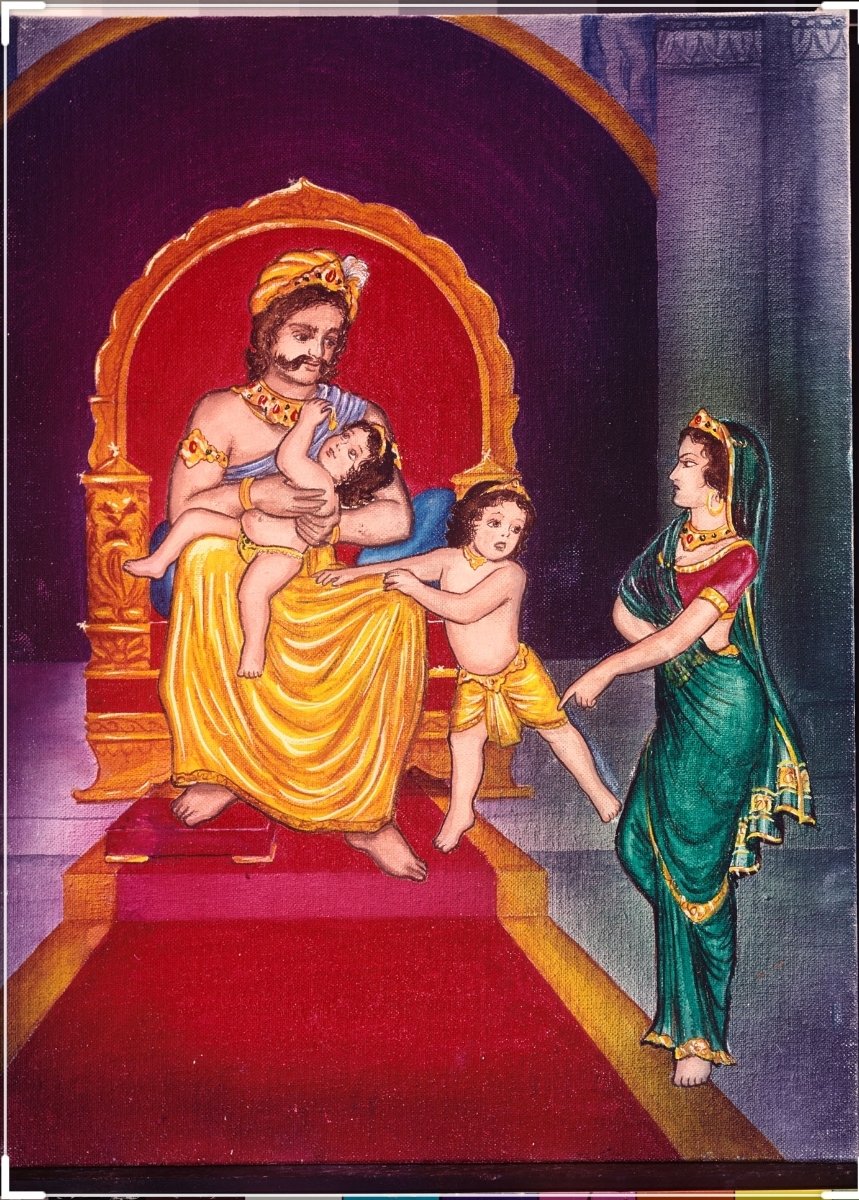
One day when Dhruva was just 5 years old he went on to sit on his father's lap. Suruchi, the jealous queen, got enraged and shoved him away from Raja as she never wanted Raja to shower Dhruva with his fatherly affection.
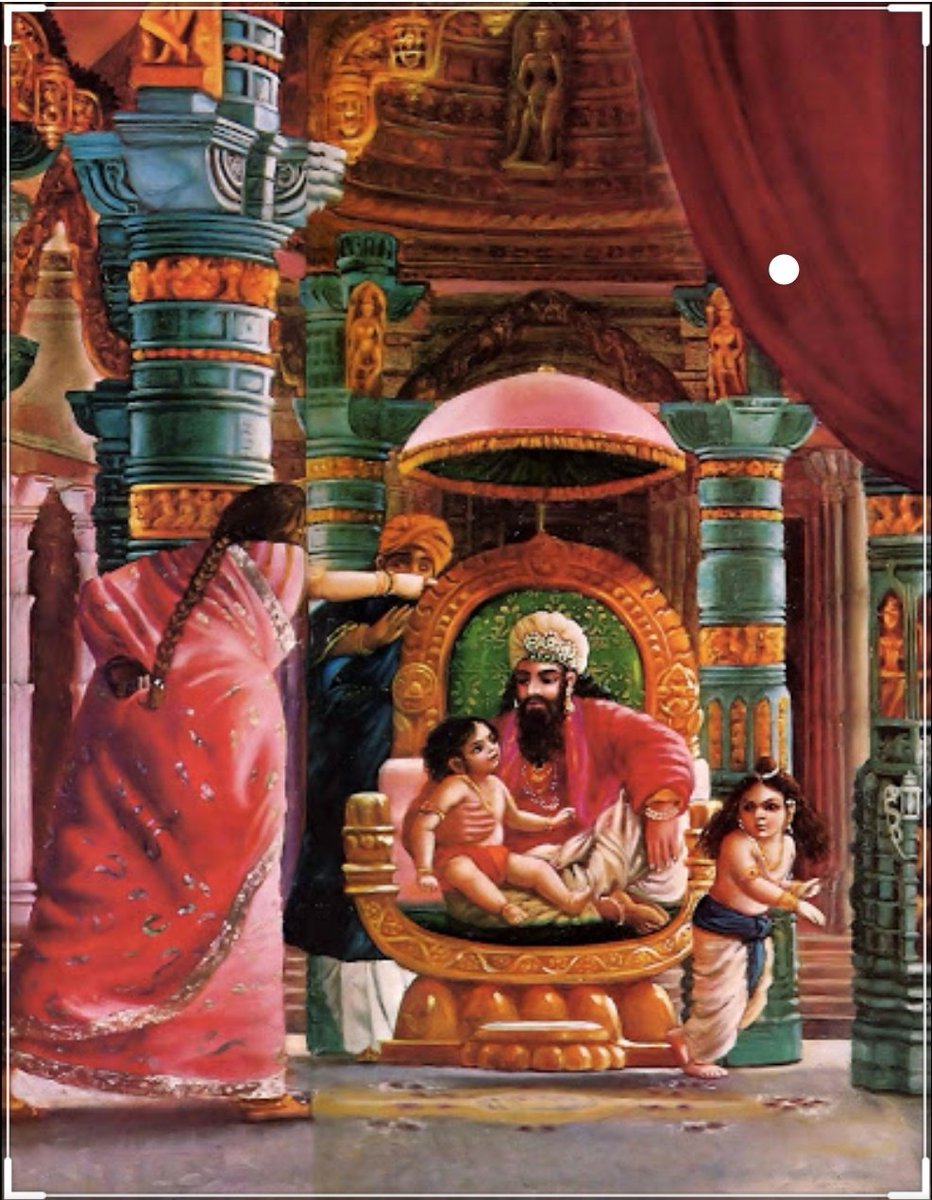
Dhruva protested questioning his step mother "why can't i sit on my own father's lap?" A furious Suruchi berated him saying "only God can allow him that privilege. Go ask him"
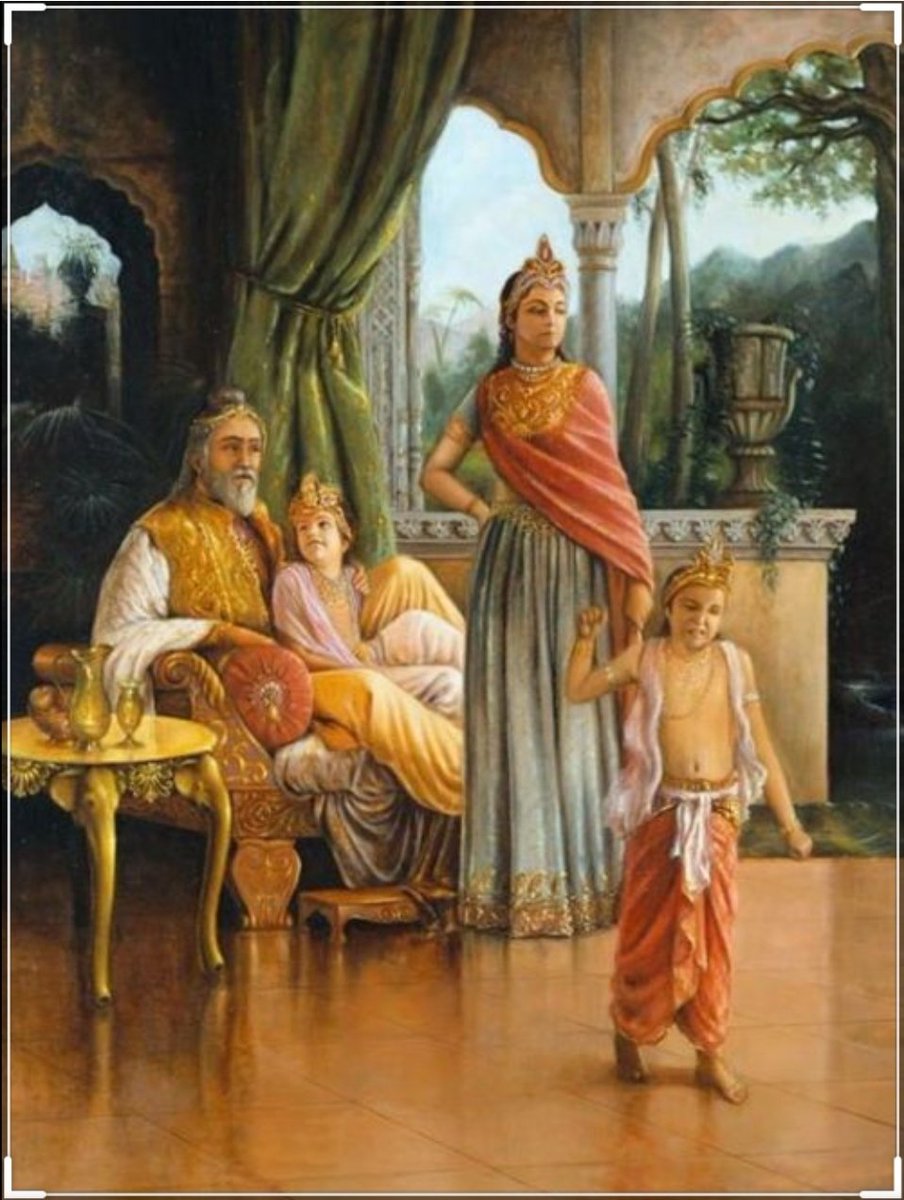
Once upon a time there was a Raja named Uttānapāda born of Svayambhuva Manu,1st man on earth.He had 2 beautiful wives - Suniti & Suruchi & two sons were born of them Dhruva & Uttama respectively.
#talesofkrishna https://t.co/E85MTPkF9W
Prabhu says i reside in the heart of my bhakt.
— Right Singh (@rightwingchora) December 21, 2020
Guess the event. pic.twitter.com/yFUmbfe5KL
Now Suniti was the daughter of a tribal chief while Suruchi was the daughter of a rich king. Hence Suruchi was always favored the most by Raja while Suniti was ignored. But while Suniti was gentle & kind hearted by nature Suruchi was venomous inside.
#KrishnaLeela
The story is of a time when ideally the eldest son of the king becomes the heir to the throne. Hence the sinhasan of the Raja belonged to Dhruva.This is why Suruchi who was the 2nd wife nourished poison in her heart for Dhruva as she knew her son will never get the throne.
One day when Dhruva was just 5 years old he went on to sit on his father's lap. Suruchi, the jealous queen, got enraged and shoved him away from Raja as she never wanted Raja to shower Dhruva with his fatherly affection.
Dhruva protested questioning his step mother "why can't i sit on my own father's lap?" A furious Suruchi berated him saying "only God can allow him that privilege. Go ask him"