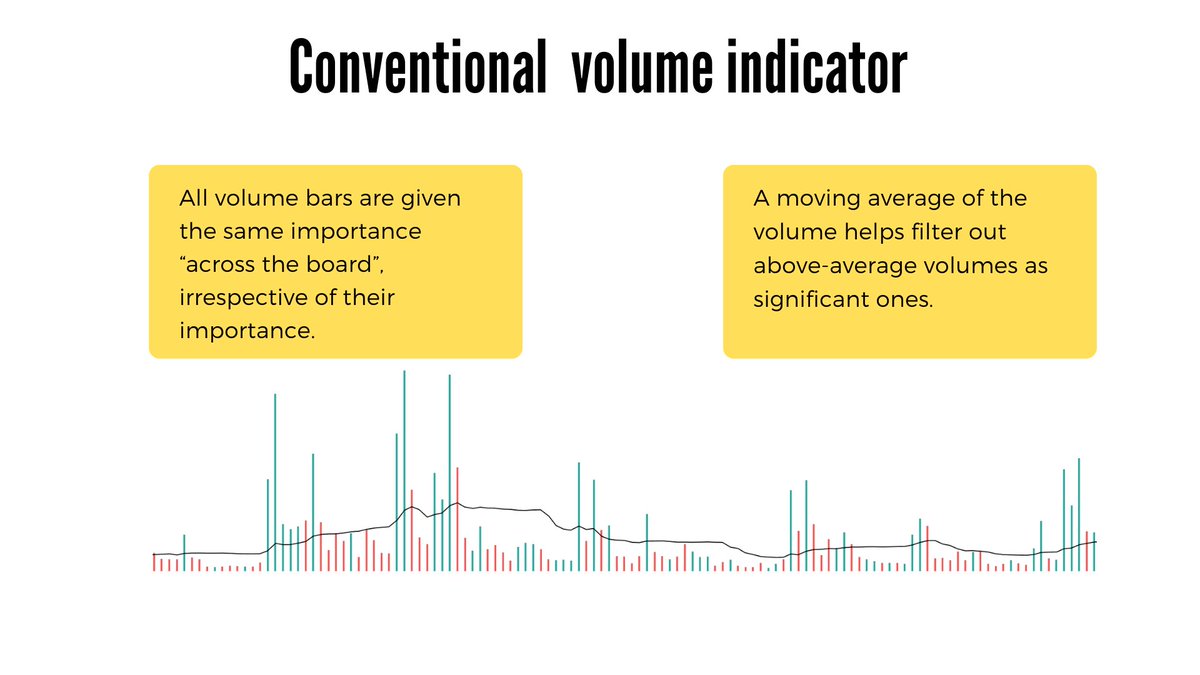
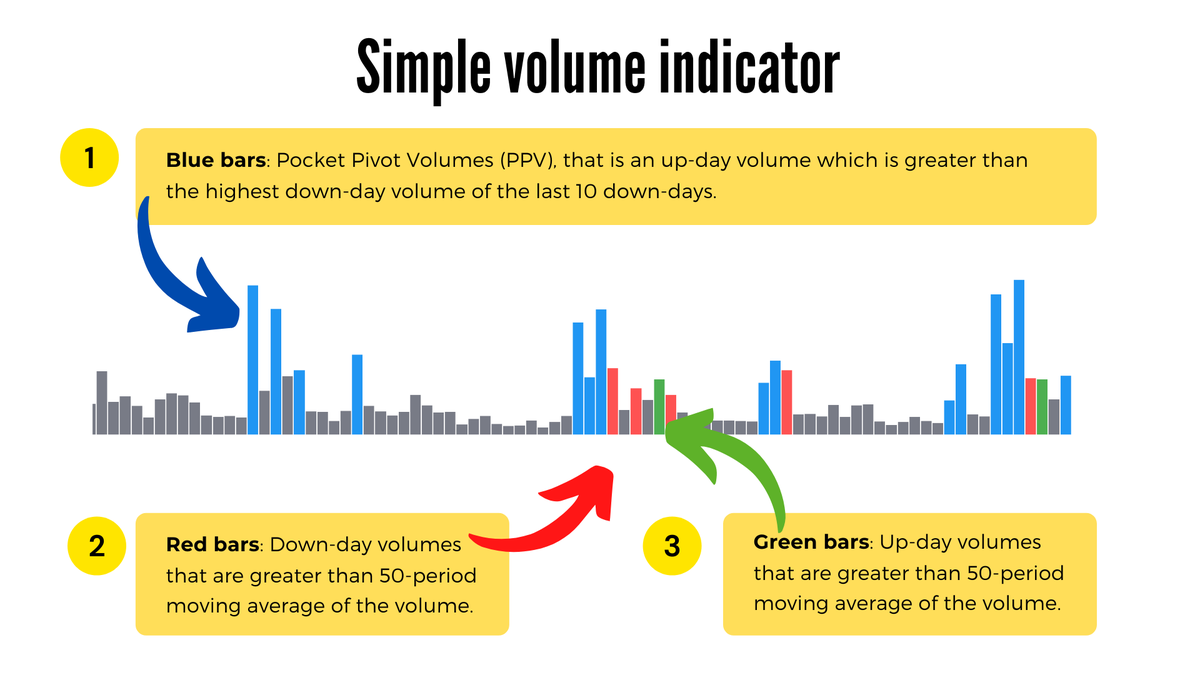
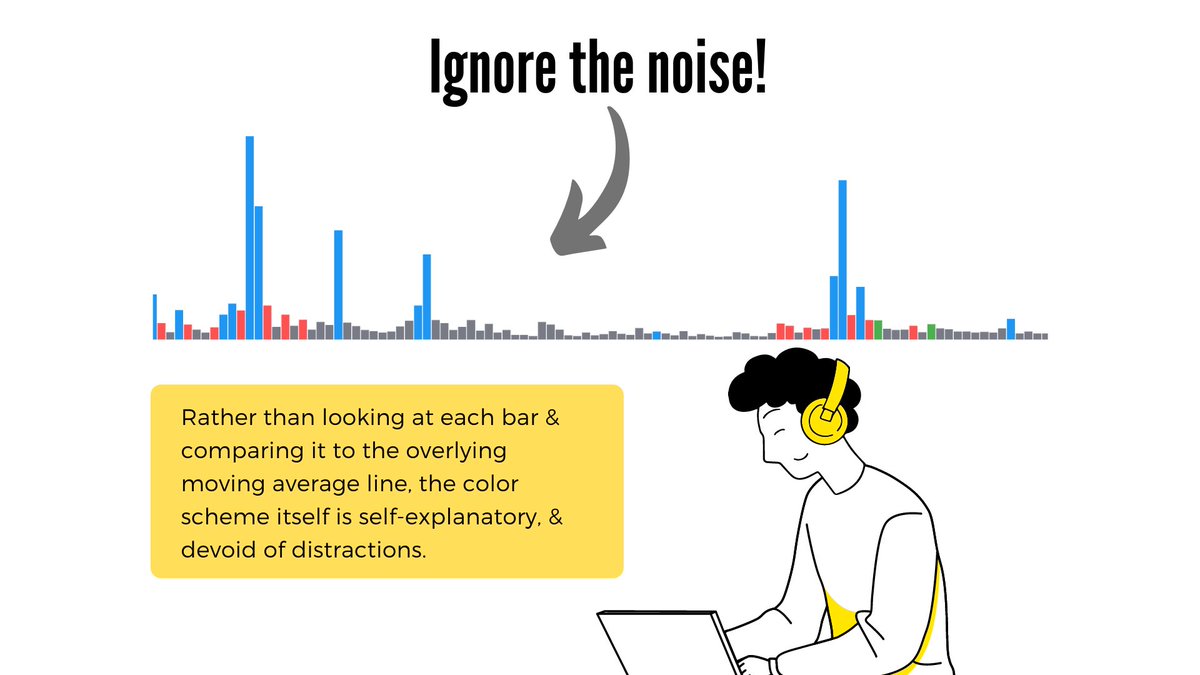
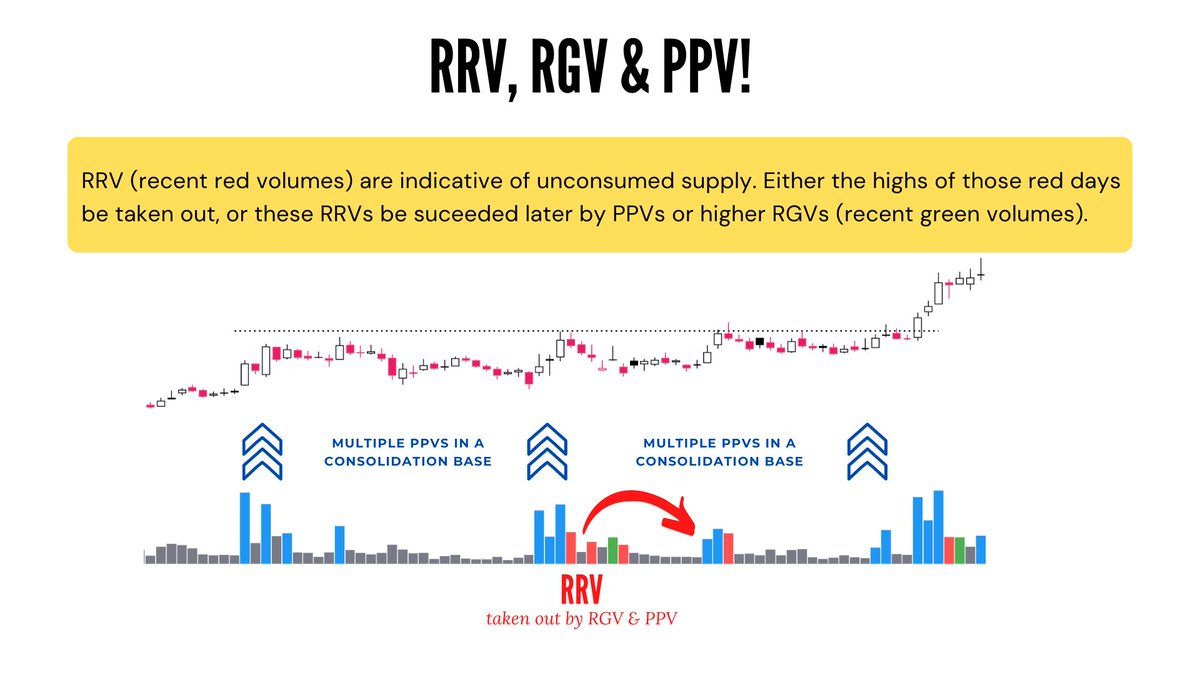
The time has finally arrived to simplify how we use the volume indicator on our charts. With a Tradingview script at the end, here is a thread🧵 on what “simple” volumes are, & how to use them: 👇
https://t.co/y801M17j9R
More from Nitin R


I try to look for exhaustion of supply, drying down of volumes, & narrowing of daily/weekly ranges. Enter after an upmove, on the lowest volume & the smallest daily range, as the stock forms a low volume doji/inside bar while in pullback/retest at/in/near the zone of 10MA & 20MA.
I m watching your posts... amazing sir.... thanks for sharing.... can you share what is your trade set up
— Sahasra (@h_shanmugavelu) March 21, 2022
More from Screeners

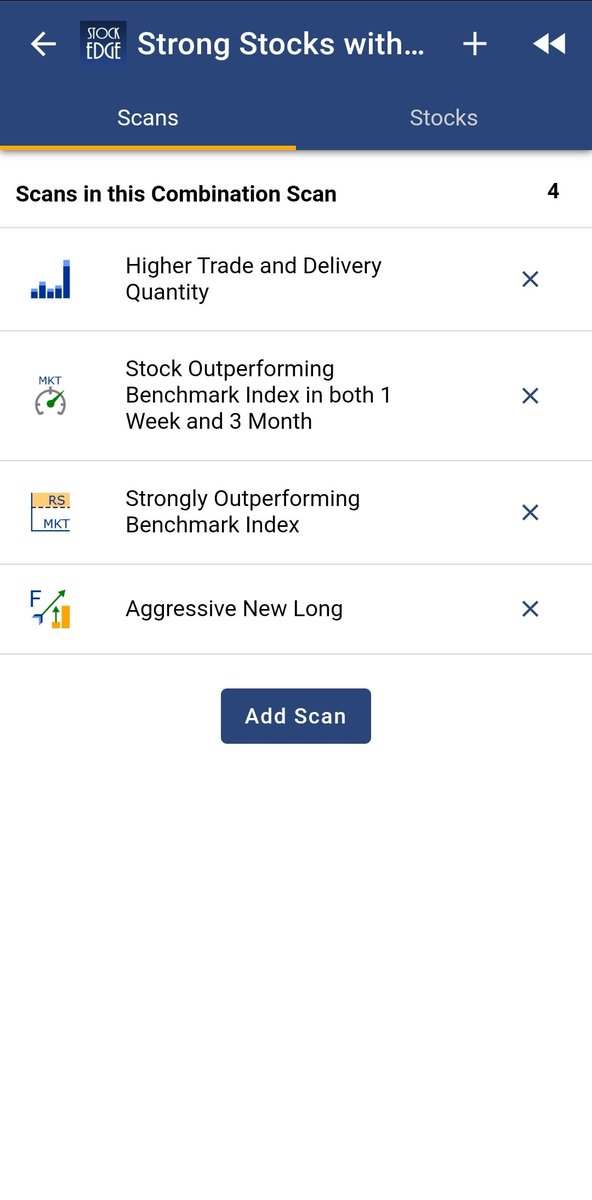


I use 4 scanners:
1) Volatility, Volume & daily range compression scanner
2) Punch-Drunk-Love
3) GE Ratio - to track fundamentally strong stocks
4) Recently created one to track Power Play setups.
I get around 150-200 stocks daily & choose the ones with the most potential.
1) Volatility, Volume & daily range compression scanner
2) Punch-Drunk-Love
3) GE Ratio - to track fundamentally strong stocks
4) Recently created one to track Power Play setups.
I get around 150-200 stocks daily & choose the ones with the most potential.
Sir, How do u find a set up - Do you track chart of each stock daily ? Or do u have filters , that lead you to a number of stocks , after which you scan them.
— AKASH GUPTA (@lockdownmurti) August 25, 2021