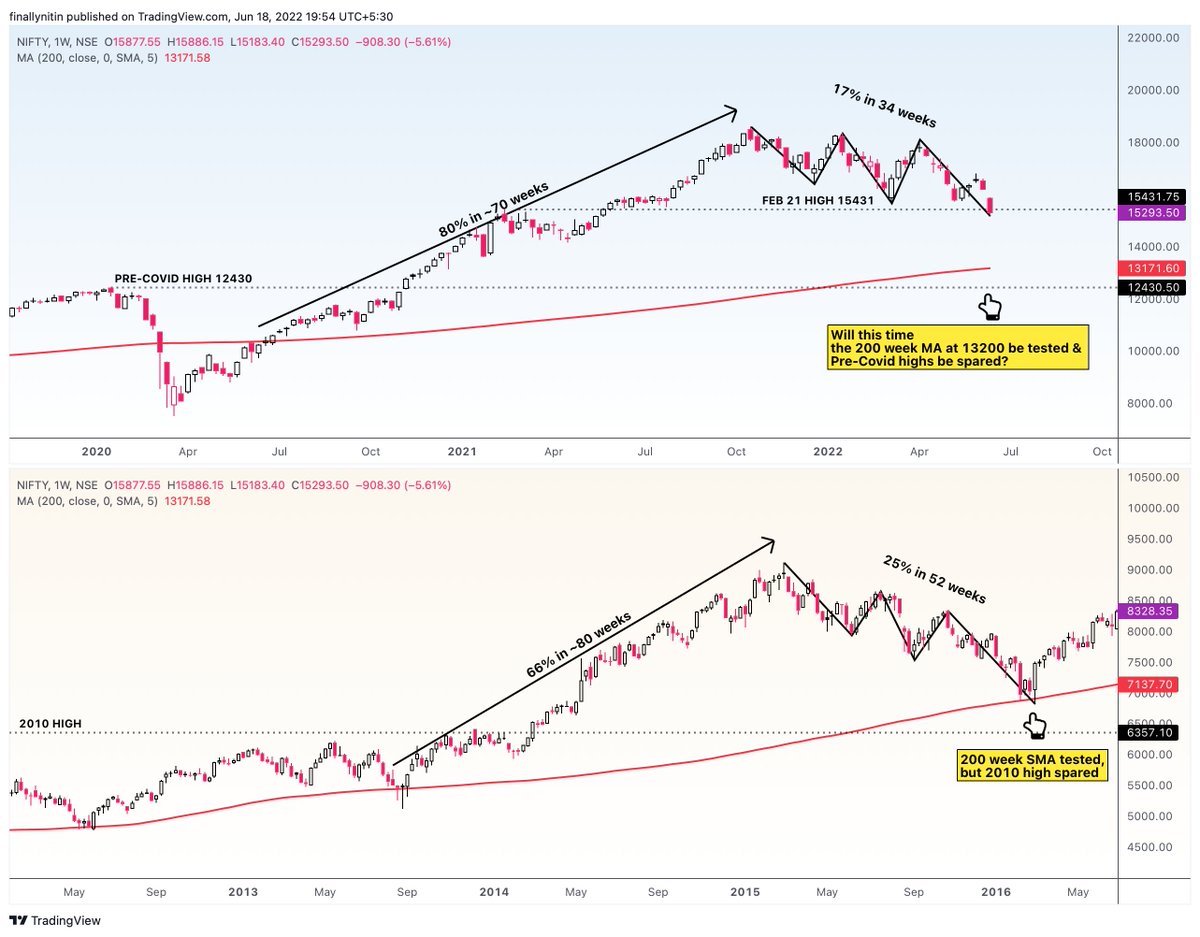
#NIFTY weekly chart showing some similarities with the 2015-16 fall.
Both falls were preceded by an almost non-stop bull run for 1-2 years (counting from last retest of 200-week SMA).
In 2015-16, index fell 25% in 52 weeks. So far, from Oct 21, we have fallen 17% in 34 weeks.
More from Nitin R


I try to look for exhaustion of supply, drying down of volumes, & narrowing of daily/weekly ranges. Enter after an upmove, on the lowest volume & the smallest daily range, as the stock forms a low volume doji/inside bar while in pullback/retest at/in/near the zone of 10MA & 20MA.
I m watching your posts... amazing sir.... thanks for sharing.... can you share what is your trade set up
— Sahasra (@h_shanmugavelu) March 21, 2022


More from Niftylongterm


Well, alarms were sound.
₹Nifty > #Nifty
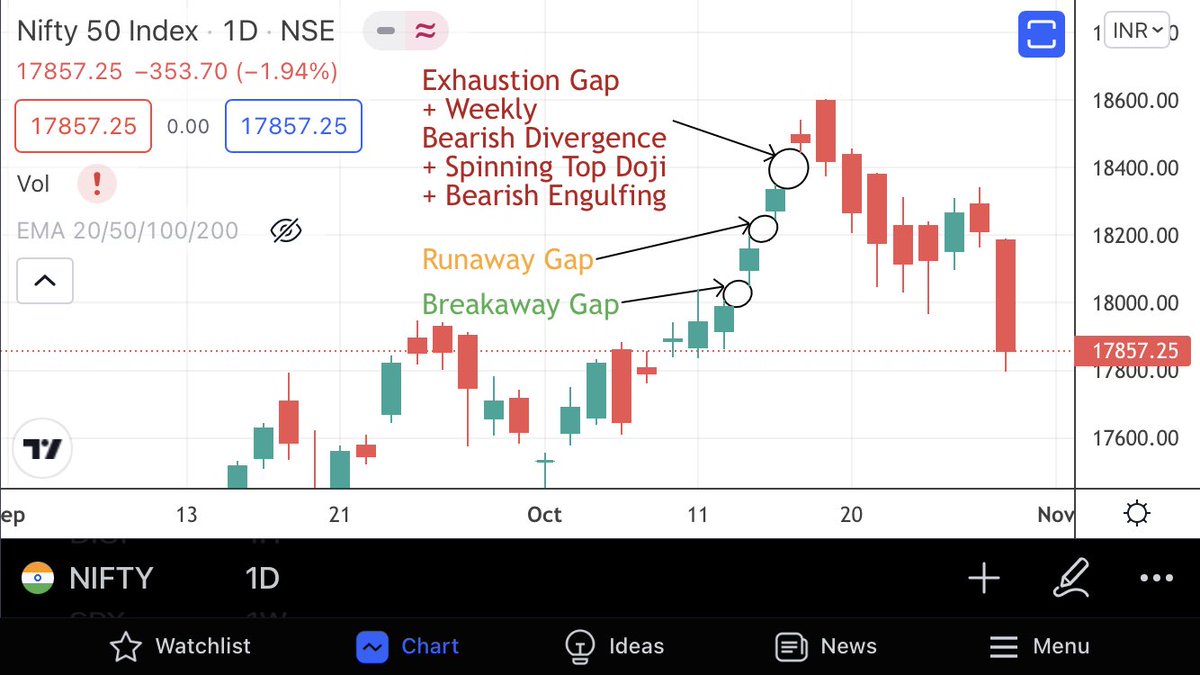
Explanation for the alarm that sounded. Textbook short term top.
Clean technicals.
₹Nifty > #Nifty
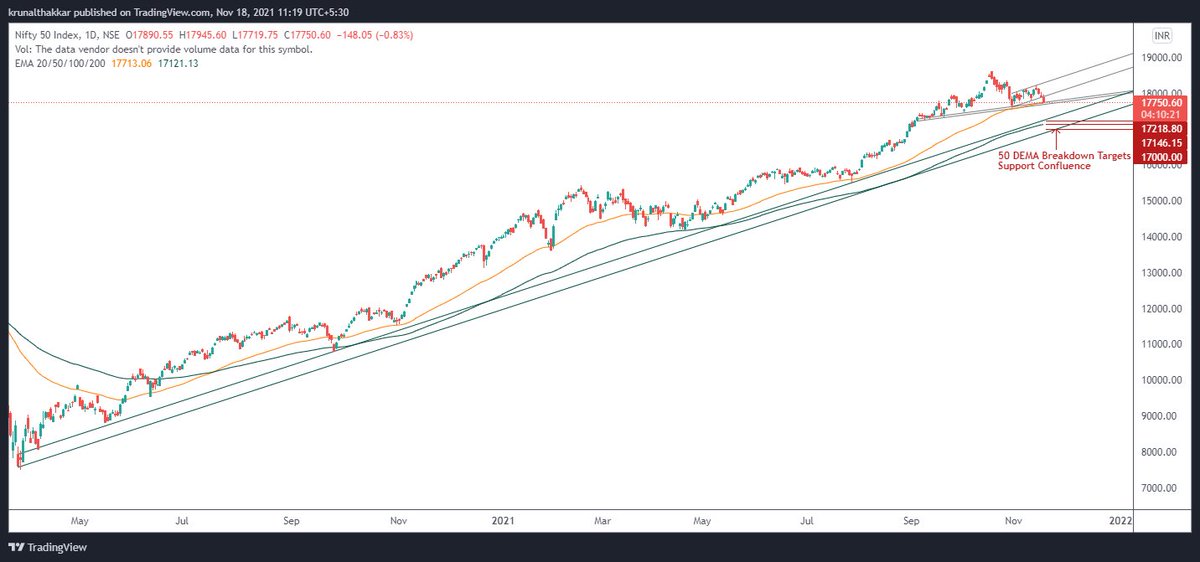
Is Nifty gunning for an ultimate double zig-zag shake out towards 17k which would coincide with weekly 20 EMA and 100 DEMA tag? Fair possibility. Only time will tell. Watch for the break of 50 DEMA and support zone.
₹Nifty > #Nifty
@piyushchaudhry
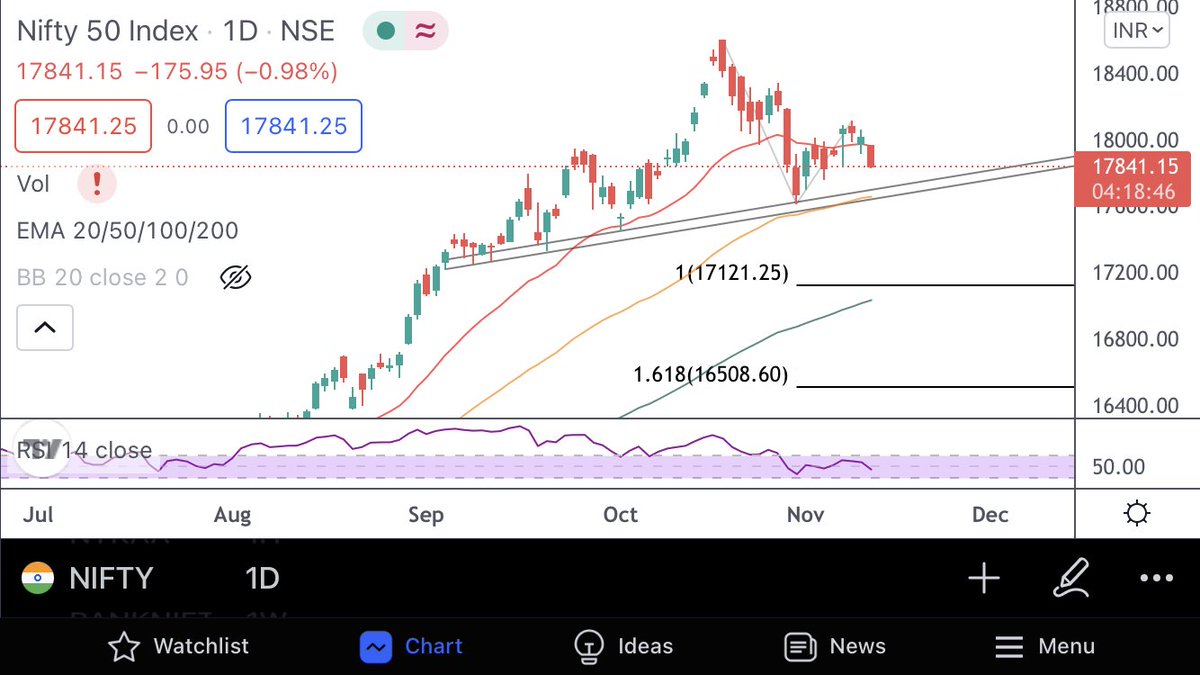
If Nifty breaks 50 DEMA and closes below 17700. 17220-17150-17000 possible. Worst case scenario is ~17000. Lot of confluence support in that range.
Do your DD.
₹Nifty > #Nifty
Nifty’s daily looks like ABC is done, but internals suggests that it still needs a final sell off to make a bottom for WXY. A bull trap towards 17735-17810 can’t be ruled out before the final sell off.
Just analysis, reserve the right to be wrong.
₹Nifty > #Nifty
₹Nifty > #Nifty
Tight Bearish divergence on Nifty Weekly. Ready to snap back to Weekly 20 EMA? Current Weekly 20 EMA at 16864. Stay Cautious!
— Krunal Thakkar (@KrunallThakkar) October 22, 2021
\u20b9Nifty > #Nifty
Explanation for the alarm that sounded. Textbook short term top.
Clean technicals.
₹Nifty > #Nifty
Is Nifty gunning for an ultimate double zig-zag shake out towards 17k which would coincide with weekly 20 EMA and 100 DEMA tag? Fair possibility. Only time will tell. Watch for the break of 50 DEMA and support zone.
₹Nifty > #Nifty
@piyushchaudhry
If Nifty breaks 50 DEMA and closes below 17700. 17220-17150-17000 possible. Worst case scenario is ~17000. Lot of confluence support in that range.
Do your DD.
₹Nifty > #Nifty
Nifty’s daily looks like ABC is done, but internals suggests that it still needs a final sell off to make a bottom for WXY. A bull trap towards 17735-17810 can’t be ruled out before the final sell off.
Just analysis, reserve the right to be wrong.
₹Nifty > #Nifty


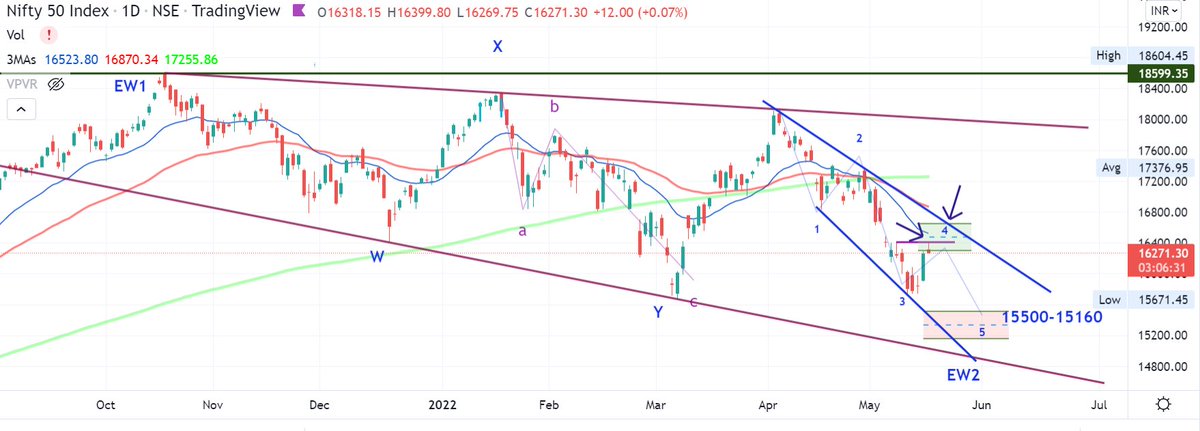
Nifty 50-Until 16600 is crossed then there is every chance of one more leg downwards (Wave5)
If it closes below 15700 then we can see 15500/15160
5th wave-can get truncated,
Get rid of kachra!!
Good opportunity to accumulate quality companies
chart👇
cheers https://t.co/b0M5QRcq7e
If it closes below 15700 then we can see 15500/15160
5th wave-can get truncated,
Get rid of kachra!!
Good opportunity to accumulate quality companies
chart👇
cheers https://t.co/b0M5QRcq7e
Please use the opportunity to move out of the low-quality companies into high-quality companies.
— Moneyspinners - Work Hard, Dream Big!! (@Jai0409) May 18, 2022