
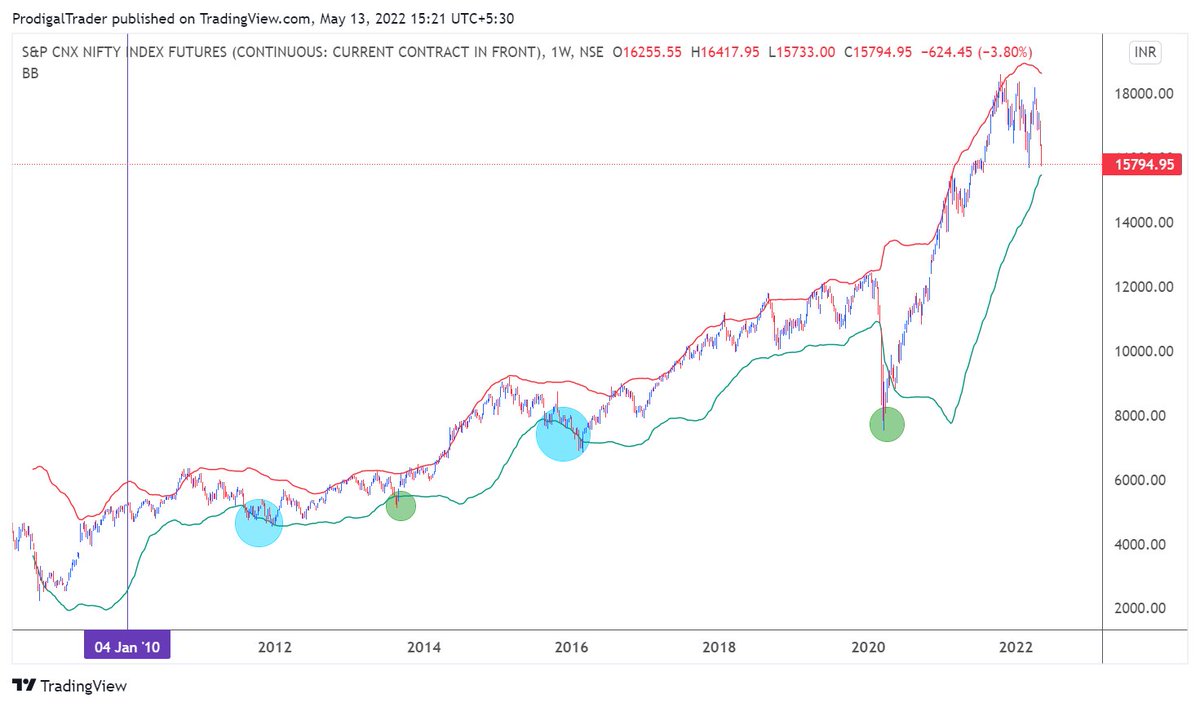
Do u want to study past bear markets?
Use Weekly chart
Plot Bollinger Bands with 50,2 setting
Locate when ever price hit lower band
Locate the highest swing high befoire the fall
The period in between is bear market
Here we have 4 such occations after 2010.
More from Aneesh Philomina Antony (ProdigalTrader)


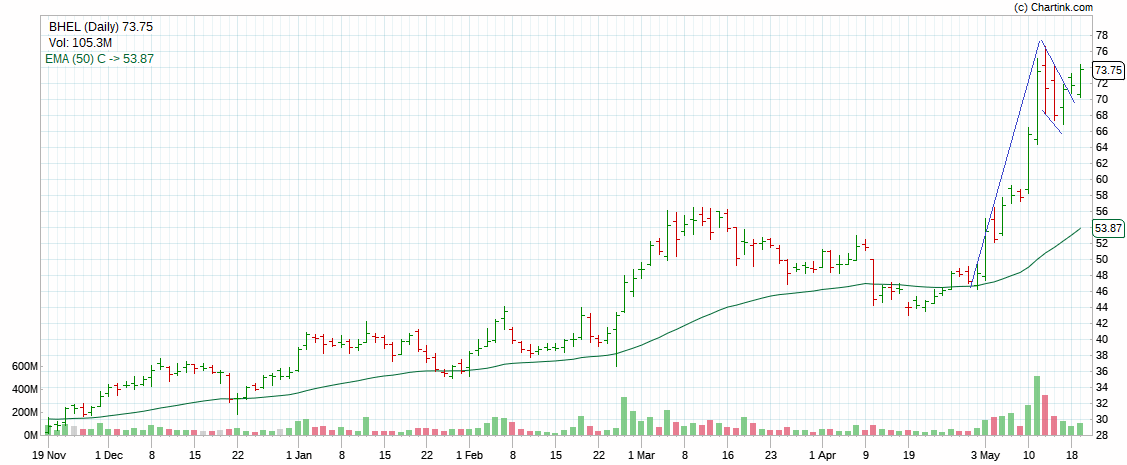
1.Price structure - higher swing highs & swing lows
2. Momentum - doubled in last 250 days & trade close to recent highs
3. Demand - Higher volume on green bars
4. Volatility - Bigger bars on upside & shorter on downside
5. Relative strength - Outperforming market
Hello Aneesh, (1) apart from the volume supported HH-HL formation in ATH or 52 weeks high stocks, what other data point u see to shortlist scrip? (2) How do u estimate the holding period for the scrip? Plz guide
— Rohit Khanna\U0001f1ee\U0001f1f3 (@Rohit_MktWale) March 26, 2022
Aneesh ji, Like in PA we have undercut and reclaim of some major MA some significance, does it have any significance in RSI?
— Prakhar (@StocksbyPrakhar) May 12, 2022
More from Screeners


Sharing 9 Screeners🧵
1. Swing Trading Techno Funda https://t.co/sV6e8XSFRK
2.Range Breakout
https://t.co/SNKEpGHNtv
3. Stocks in Tight Range :
https://t.co/MqDFMEfj82
Telegram Link : https://t.co/b4N4oPjqm9
Retweet and Share !
4.Stock Closing up 3% Since 3 days
https://t.co/vLGG9k3YKz
5. Close above 21 ema
https://t.co/fMZkgLczxR
6. Days Fall and Reversal
7. 52 WEEK high Stocks.
https://t.co/H6Z6IGMRwS
8. Intraday Stocks :https://t.co/JoXYRcogj7
9. Darvas Box

You May Also Like


Pangolins, September 2019 and PLA are the key to this mystery
Stay Tuned!

1. Yang
Meet Yang Ruifu, CCP's biological weapons expert https://t.co/JjB9TLEO95 via @Gnews202064
— Billy Bostickson \U0001f3f4\U0001f441&\U0001f441 \U0001f193 (@BillyBostickson) October 11, 2020
Interesting expose of China's top bioweapons expert who oversaw fake pangolin research
Paper 1: https://t.co/TrXESKLYmJ
Paper 2:https://t.co/9LSJTNCn3l
Pangolinhttps://t.co/2FUAzWyOcv pic.twitter.com/I2QMXgnkBJ
2. A jacobin capuchin dangling a flagellin pangolin on a javelin while playing a mandolin and strangling a mannequin on a paladin's palanquin, said Saladin
More to come tomorrow!

3. Yigang Tong
https://t.co/CYtqYorhzH
Archived: https://t.co/ncz5ruwE2W

4. YT Interview
Some bats & pangolins carry viruses related with SARS-CoV-2, found in SE Asia and in Yunnan, & the pangolins carrying SARS-CoV-2 related viruses were smuggled from SE Asia, so there is a possibility that SARS-CoV-2 were coming from

i wonder if you can make a thread bout witchcraft in malaysia.. or list of our own local gods/deites..
— r a y a \U0001f319 (@lcvelylilith) February 20, 2020
Before I begin, it might be worth explaining the Malay conception of the spirit world. At its deepest level, Malay religious belief is animist. All living beings and even certain objects are said to have a soul. Natural phenomena are either controlled by or personified as spirits
Although these beings had to be respected, not all of them were powerful enough to be considered gods. Offerings would be made to the spirits that had greater influence on human life. Spells and incantations would invoke their
Animist ceremonies of a religious or magical nature were normally held for the purpose of divination or making a request. This would either be done at a keramat or at a shrine similar to the Thai spirit houses or Chinese roadside shrines pic.twitter.com/I1hliyi0x3
— \u2745\u1710\u170b\u1713\u170e (@uglyluhan) June 16, 2019
Two known examples of such elemental spirits that had god-like status are Raja Angin (king of the wind) and Mambang Tali Arus (spirit of river currents). There were undoubtedly many more which have been lost to time
Contact with ancient India brought the influence of Hinduism and Buddhism to SEA. What we now call Hinduism similarly developed in India out of native animism and the more formal Vedic tradition. This can be seen in the multitude of sacred animals and location-specific Hindu gods