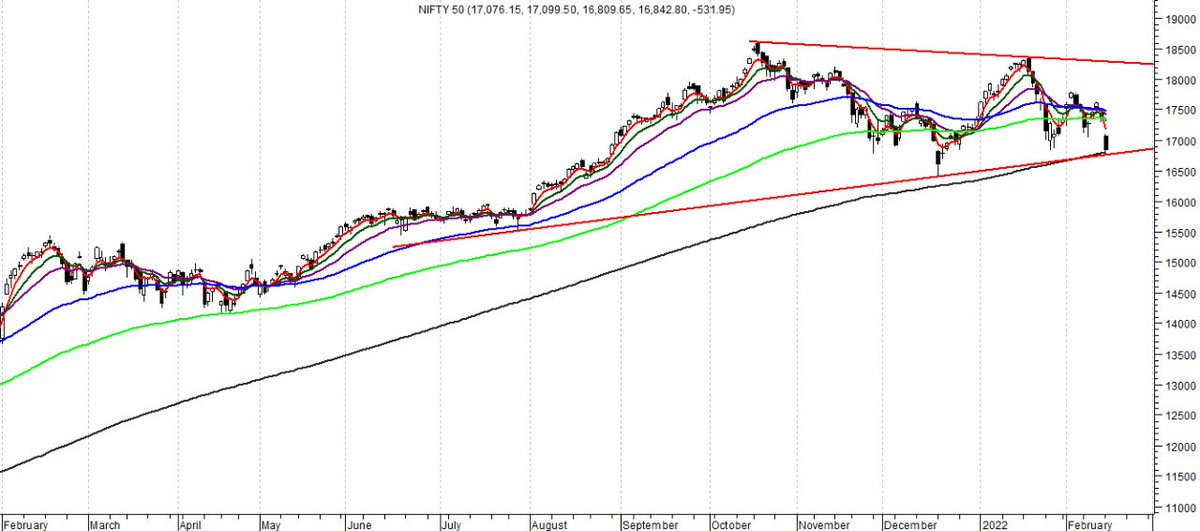
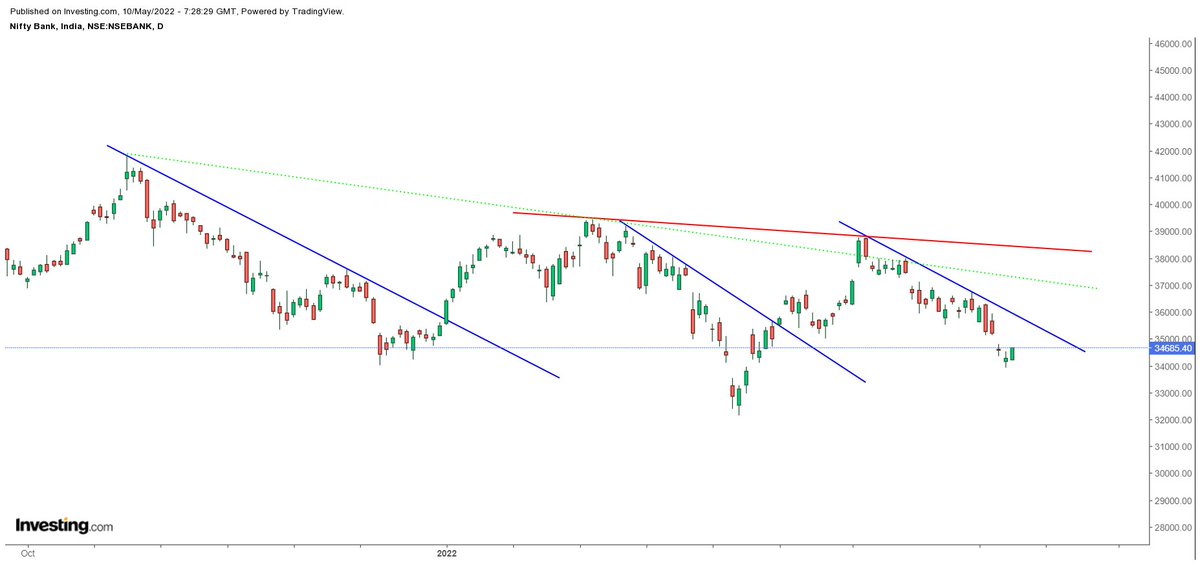
200SMA is Tested today whereas 200dema is at 16690 which is 150pts away from todays close
Post september 2020, 200dema/sma is tested now in feb 2022 n it took 1.5 yrs
200 sma 16788
200dema 16688
Today many sectors tested 200dema/Sma after 1.5 yrs which is "Mean Reversion"
More from Shivaji Vitthalrao🇮🇳
Quiz Answer
Copper break below 4.43 qualify as bearish Flag and pole
HINDCOPPER break below 157 qualify as bearish Flag n pole.
Impact copper can test 4.28-4.20
HINDCOPPER can test 150-141 as per pattern targets.
165-166 Lakshman Rekha.
Copper break below 4.43 qualify as bearish Flag and pole
HINDCOPPER break below 157 qualify as bearish Flag n pole.
Impact copper can test 4.28-4.20
HINDCOPPER can test 150-141 as per pattern targets.
165-166 Lakshman Rekha.
Quiz - Hindcopper
— Shivaji Vitthalrao\U0001f1ee\U0001f1f3 (@shivaji_1983) June 9, 2021
What pattern do you see?
whats the confirmation level and impact ?
Both are interlinked. https://t.co/0gVaRXd4pS pic.twitter.com/Bbs1rdaOWf
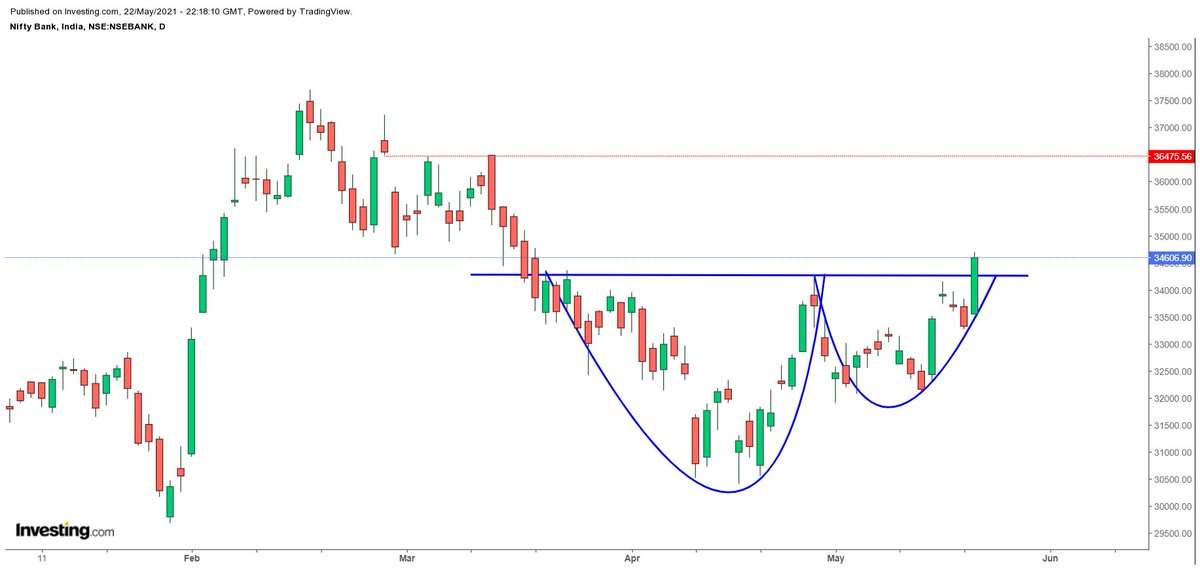
BIG Boy of PSU Bank Space #SBI is getting ready to play his innings 😀😀😍😍
Could be best innings of 2022 🤑
Could be best innings of 2022 🤑
BIG Boy of PSU Bank space is ready to make its best move after 8-9 months of consolidation.
— Shivaji Vitthalrao\U0001f1ee\U0001f1f3 (@shivaji_1983) July 7, 2022
Time for #SBI Great Again. Some more days move can trigger, stock can head towards 540-600-650-680 and more in 2022. @moneyworks4u_fa @dtbhat pic.twitter.com/N6dBJNC36s
More from Screeners


So friends here is the thread on the recommended pathway for new entrants in the stock market.
Here I will share what I believe are essentials for anybody who is interested in stock markets and the resources to learn them, its from my experience and by no means exhaustive..
First the very basic : The Dow theory, Everybody must have basic understanding of it and must learn to observe High Highs, Higher Lows, Lower Highs and Lowers lows on charts and their
Even those who are more inclined towards fundamental side can also benefit from Dow theory, as it can hint start & end of Bull/Bear runs thereby indication entry and exits.

Next basic is Wyckoff's Theory. It tells how accumulation and distribution happens with regularity and how the market actually
Dow theory is old but
Here I will share what I believe are essentials for anybody who is interested in stock markets and the resources to learn them, its from my experience and by no means exhaustive..
First the very basic : The Dow theory, Everybody must have basic understanding of it and must learn to observe High Highs, Higher Lows, Lower Highs and Lowers lows on charts and their
Even those who are more inclined towards fundamental side can also benefit from Dow theory, as it can hint start & end of Bull/Bear runs thereby indication entry and exits.
Next basic is Wyckoff's Theory. It tells how accumulation and distribution happens with regularity and how the market actually
Dow theory is old but
Old is Gold....
— Professor (@DillikiBiili) January 23, 2020
this Bharti Airtel chart is a true copy of the Wyckoff Pattern propounded in 1931....... pic.twitter.com/tQ1PNebq7d


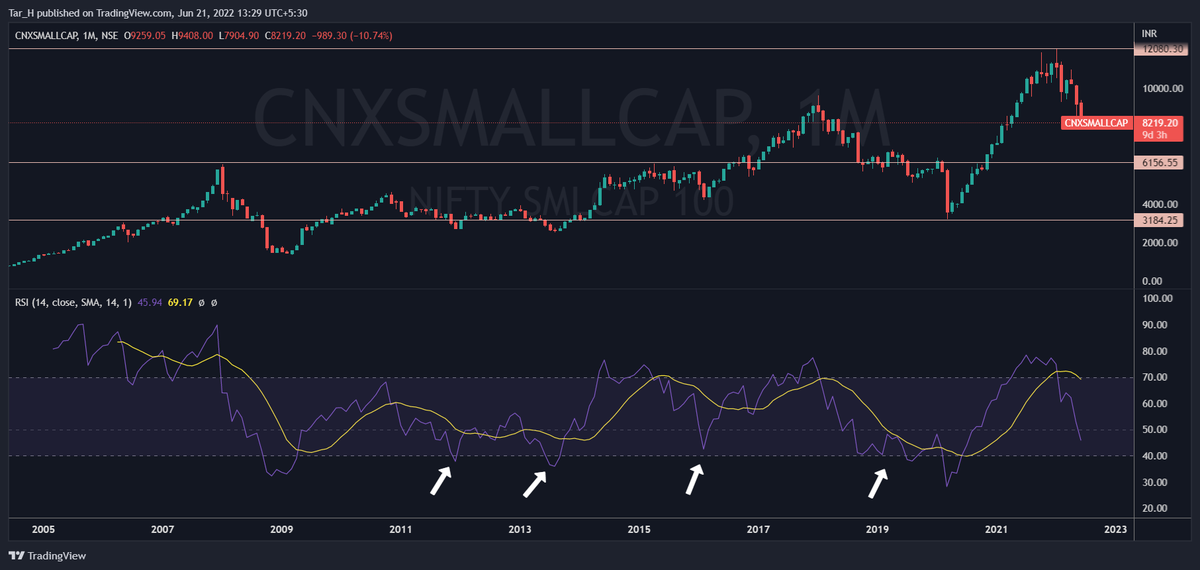
Most of the indices are entering oversold territories
Take small cap index for example
Whenever Monthly RSI is below or around 40, the index bottoms out
We are getting there.
If I had 50% cash, I would have deployed some in beaten down stocks where earnings growth is intact. https://t.co/t5WwgH1V5o
Take small cap index for example
Whenever Monthly RSI is below or around 40, the index bottoms out
We are getting there.
If I had 50% cash, I would have deployed some in beaten down stocks where earnings growth is intact. https://t.co/t5WwgH1V5o
I have more than 50% cash but still worried if this is a good time. Will invest 20% by EoY
— Tamil Metaverse (@TamilMetaverse) June 21, 2022