A Mega Thread on Price Action Trading!🧵👇

#LearnWithChartmojo #stocks #trading

1/13

Have you ever felt a lack of research as a cause of losing money?

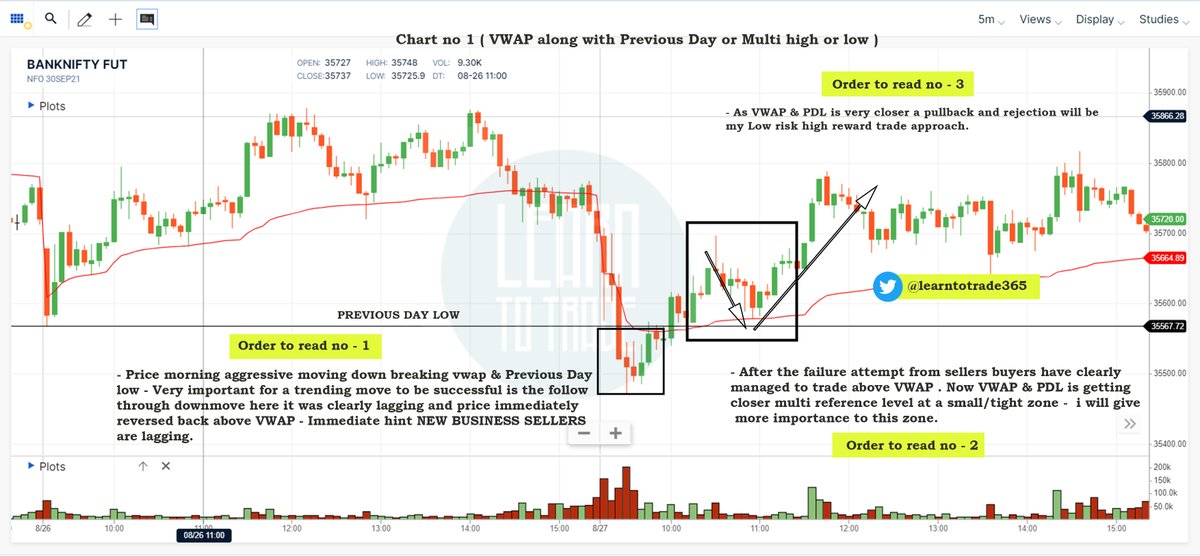
Get out of the trap by focusing on price action and following the market to make money from smart money’s research.
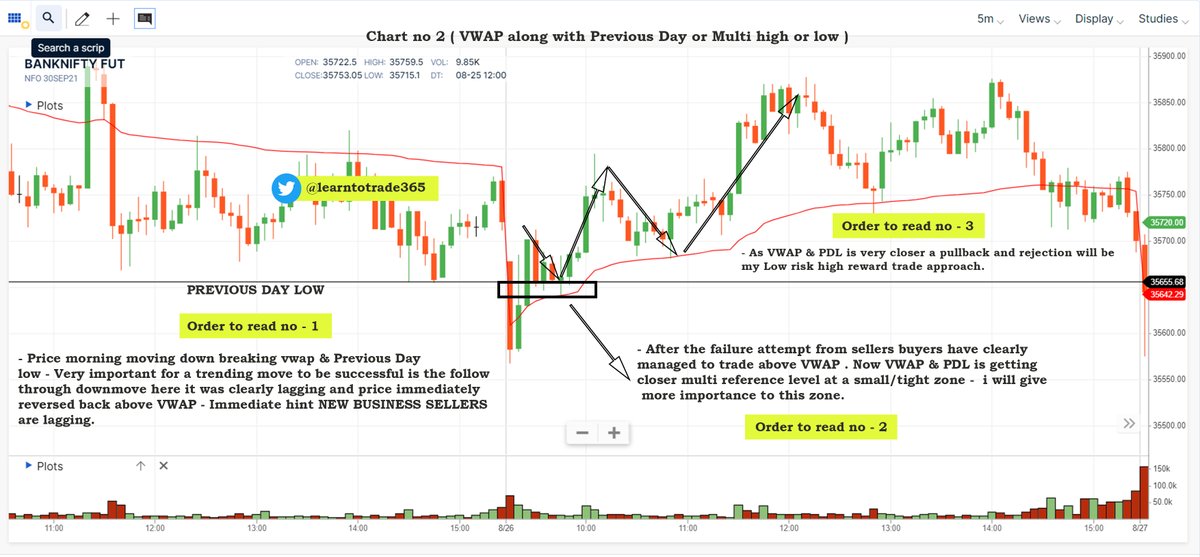
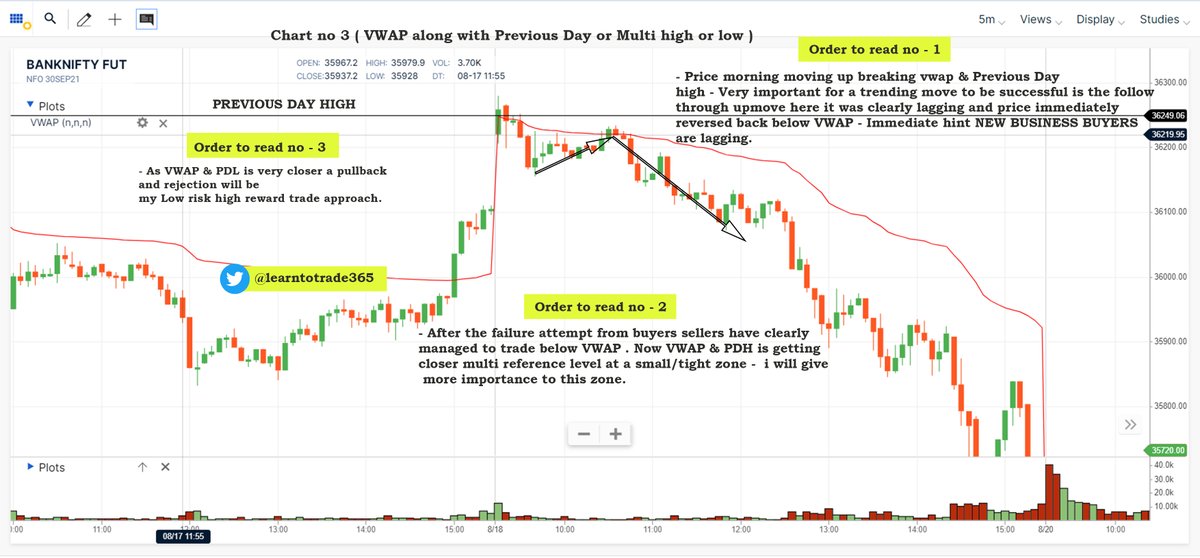
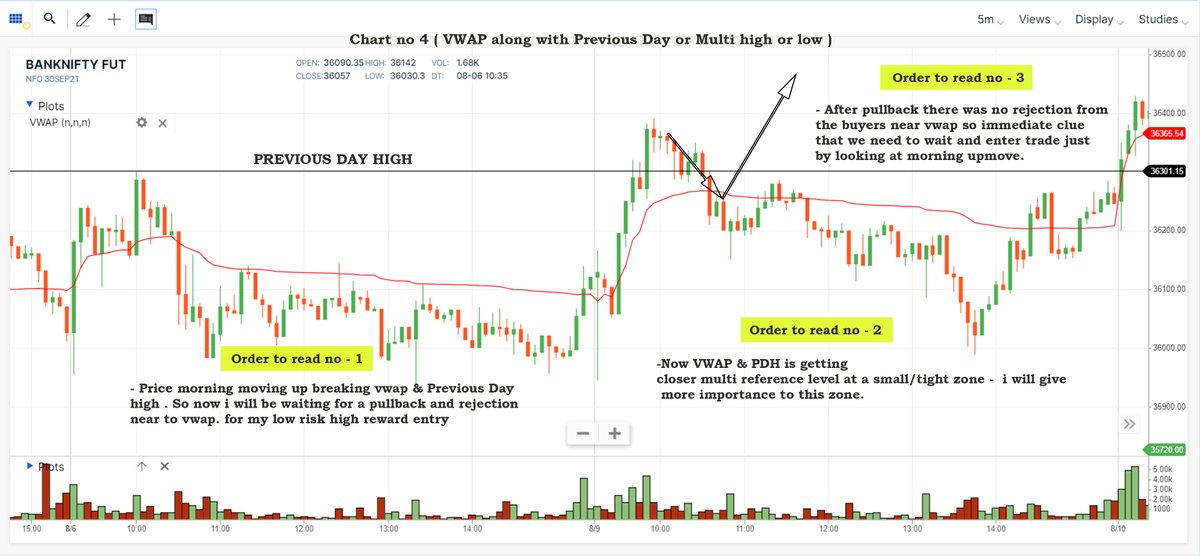
2/13

As suggested by the name, price action is the plot of a security’s price movement over a particular period.

Traders use this data to understand the temperament of the markets to make money trading profitably.
3/13

Price action trading is a widely used trading technique that relies on reading, analyzing, and interpreting the price movement of a particular security and the subsequent patterns formed due to it.
4/13

In its essence, price action trading capitalizes on the crowd mentality inherent in the markets and the consequent repetitive price behavior. It provides a psychological edge in its leading nature.
5(A)/13

Price action trading helps a retail trader understand the analysis done by the big players with sophisticated tools by looking at the price movement of security without being affected by various noises prevalent in the financial world.....
5(B)/13

.....Furthermore, it helps us see the interaction between the multiple players in the market. Intimidating, right?
6/13

There are several types of charts on which a trader can do plotting of price movement; sometimes, for example, line charts, bar charts, point and figure charts, candlestick charts.
7/13

Candlestick charts are the most valuable charts since candlesticks show four price points throughout a period and provide the perfect infrastructure for analyzing patterns.
8/13

A candlestick or a Japanese candlestick is made up of a rectangular body that depicts the Open (O), High (H), Low(L), and Close(C) of the movement of a stock.
9/13

The three components of a candlestick include the following, real body or the part connecting the opening price and the closing price, the upper shadow, and the lower shadow.
10/13

A group of candlesticks present chart patterns that help us systematically reach entry and exits for trades. Applying price action trading techniques helps us understand the language of the markets in terms of recurring patterns formed in the markets.
11/13

As is well known, the markets don’t move unidirectionally, sometimes bulls win, sometimes bears and sometimes it’s a draw. A trendline helps visualize who is winning.
12/13

Theoretically, an excess demand over supply causes an upward trend; an extra supply over demand causes a downward trend, and a supply-demand match results in a sideways movement or consolidation.
13/13

Understanding the market trend helps us gauge the market sentiment and apply the most suitable trading strategy in that environment.

Happy Reading!

More from Chartmojo

More from Screeners

Time for a new thread on the possibilities I am looking for.
Do read it completely to understand the stance and the plan.


1. The moving average structure - Many traders just look at the 200 ma test or closing above/below it regardless of its slope. Let's look at all the interactions with 200 ma where price met it for the first time after the trend change but with 200 ma slope against it


One can clearly sense that currently it is one of those scenarios only. I understand that I might get trolled for this, but an unbiased mind suggests that odds are highly against the bulls for making fresh investments.

But markets are good at giving surprises. What should be our stance if price kept on rising? Let's understand that through charts. The concept is still the same. Divergent 200 ma and price move results in 200 ma test atleast once which gives good investment opportunities.


2. Zig-Zag bear market- There are two types of fall in a bear market, the first one is vertical fall which usually ends with ending diagonals (falling wedges) and the second one is zig zag one which usually ends with parabolic down moves.

You May Also Like